.svg)

Sep-2026
Sales
Trend
6-Month
Product Count
SKUs
Avg Price
YoY Sales Change
YoY Price Change


Market Insights Snapshot
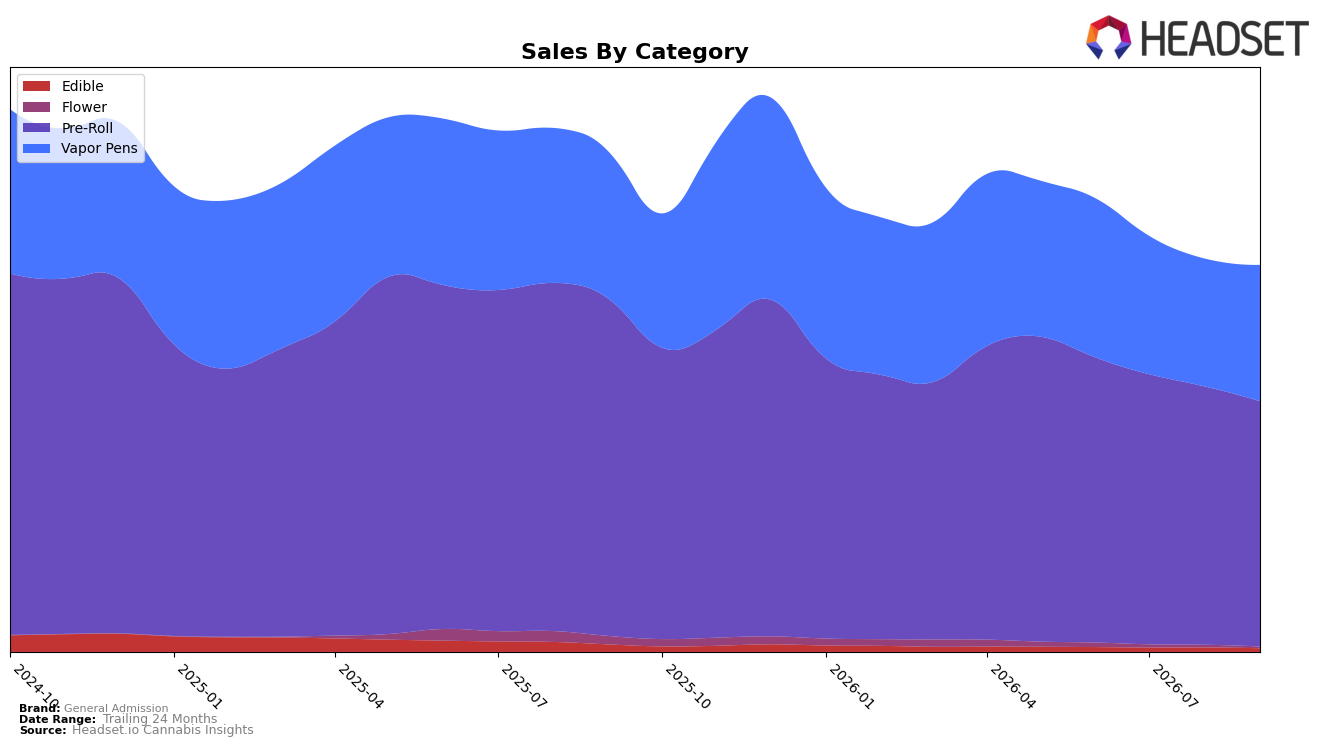
General Admission’s category mix in September 2026 is concentrated in Pre-Roll at 63.52% share and Vapor Pens at 35.25% share, while Edible sits at 0.87% and Flower at 0.36%. Pre-Roll declined 27.31% year over year and 5.05% month over month, whereas Vapor Pens fell 7.48% year over year but rose 6.59% month over month. Edible contracted 53.48% year over year and 18.55% month over month, and Flower dropped 82.96% year over year and 41.09% month over month. With brand-wide sales down 22.75% year over year and average price up 3.49%, the pattern implies a portfolio leaning into higher-priced formats while the legacy Pre-Roll base cools seasonally and structurally.
The shift toward Vapor Pens gaining month-over-month while Pre-Roll softens month-over-month indicates mix migration into a premiumized inhalable set, supported by a September 2026 average price of $29.37 and a Vapor Pens average price of $34.93. Maintaining a Pre-Roll category rank of 2 in Alberta despite a 27.31% year-over-year Pre-Roll decline suggests durable shelf presence but waning velocity, and the near-exit scale in Edible at 0.87% share and Flower at 0.36% share concentrates risk in two inhalable formats. The implication is that brand positioning is consolidating around inhalables with a tilt toward higher-ticket Vapor Pens to offset Pre-Roll volatility, requiring pricing and assortment calibration to prevent further erosion of the 63.52% Pre-Roll anchor while monetizing the 6.59% month-over-month Vapor Pens upswing.
Competitive Landscape
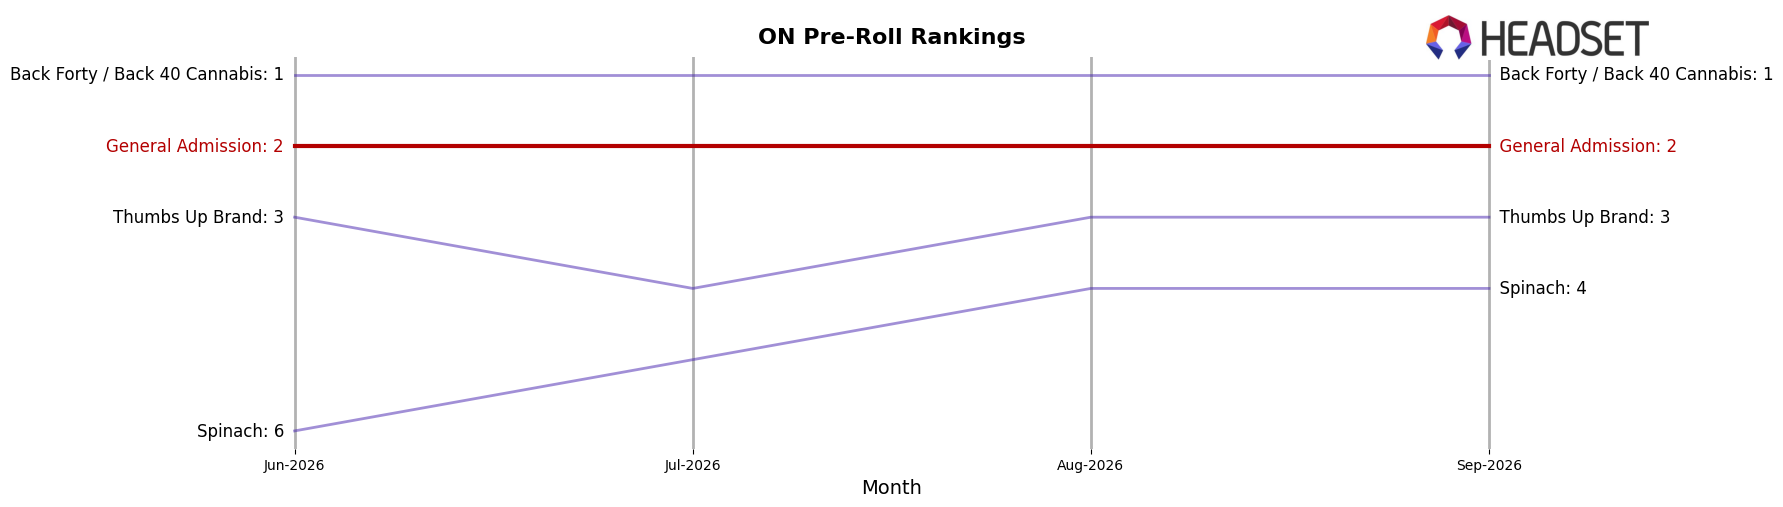
General Admission sits at #2 in ON Pre-Roll in September 2026 after a year-over-year slip from #1, holding the same #2 position seen three months prior while having previously peaked at #1 in December 2025; meanwhile, Back Forty / Back 40 Cannabis advanced year over year from #2 to #1 as its sales expanded by 46.6%, and Thumbs Up Brand climbed from #8 to #3 with 62.1% growth, outpacing category momentum and compressing the gap above and below #2. Further pressure emerges from Spinach, which jumped from #17 to #4 on 141.2% YoY growth, while Claybourne Co. fell from #4 to #5 with a 21.8% decline, signaling that General Admission’s trajectory implies a defensive posture is now required to protect #2 and re-contest #1 as faster-rising peers redirect share.
Notable Products
Berry Sunshine Hi-Fi Diamond Infused Pre-Roll 3-Pack (1.5g) posted the steepest decline in September 2026 at -22.6% and slipped to rank 10, while Tiger Blood Distillate Infused Pre-Roll (1g) fell -10.7% at rank 5, together pointing to pressure on lower-count and single-stick formats. At the top, Tiger Blood Distillate Infused Pre-Roll 5-Pack (2.5g) held rank 1 despite a -3.0% dip and Tiger Blood Diamond Infused Pre-Roll 3-Pack (1.5g) in rank 2 inched up +1.0%, and five of the top ten are Pre-Roll SKUs, indicating the franchise remains concentrated in infused Pre-Rolls even as volatility rises. In contrast, Vapor Pens advanced with Tiger Blood Liquid Diamond Disposable (1g) up +13.9% at rank 3 and Sweet Bubba Liquid Diamond Disposable (1g) up +14.0% at rank 4, suggesting mix is tilting toward higher-consumption inhalables as single-serve edibles such as Tiger Blood Chews 2-Pack (10mg) declined -11.0% at rank 8. Overall, the pattern implies General Admission is leaning into multi-pack infused Pre-Rolls and fast-turn Vapor Pens to offset softness in smaller formats, a direction that supports basket-size growth despite SKU-level pullbacks.
Top Selling Cannabis Brands






Data for this report comes from real-time sales reporting by participating cannabis retailers via their point-of-sale systems, which are linked up with Headset’s business intelligence software. Headset’s data is very reliable, as it comes digitally direct from our partner retailers. However, the potential does exist for misreporting in the instance of duplicates, incorrectly classified products, inaccurate entry of products into point-of-sale systems, or even simple human error at the point of purchase. Thus, there is a slight margin of error to consider. Brands listed on this page are ranked in the top twenty within the market and product category by total retail sales volume.

