Jun-2026
Sales
Trend
6-Month
Product Count
SKUs
Avg Price
YoY Sales Change
YoY Price Change
Market Insights Snapshot
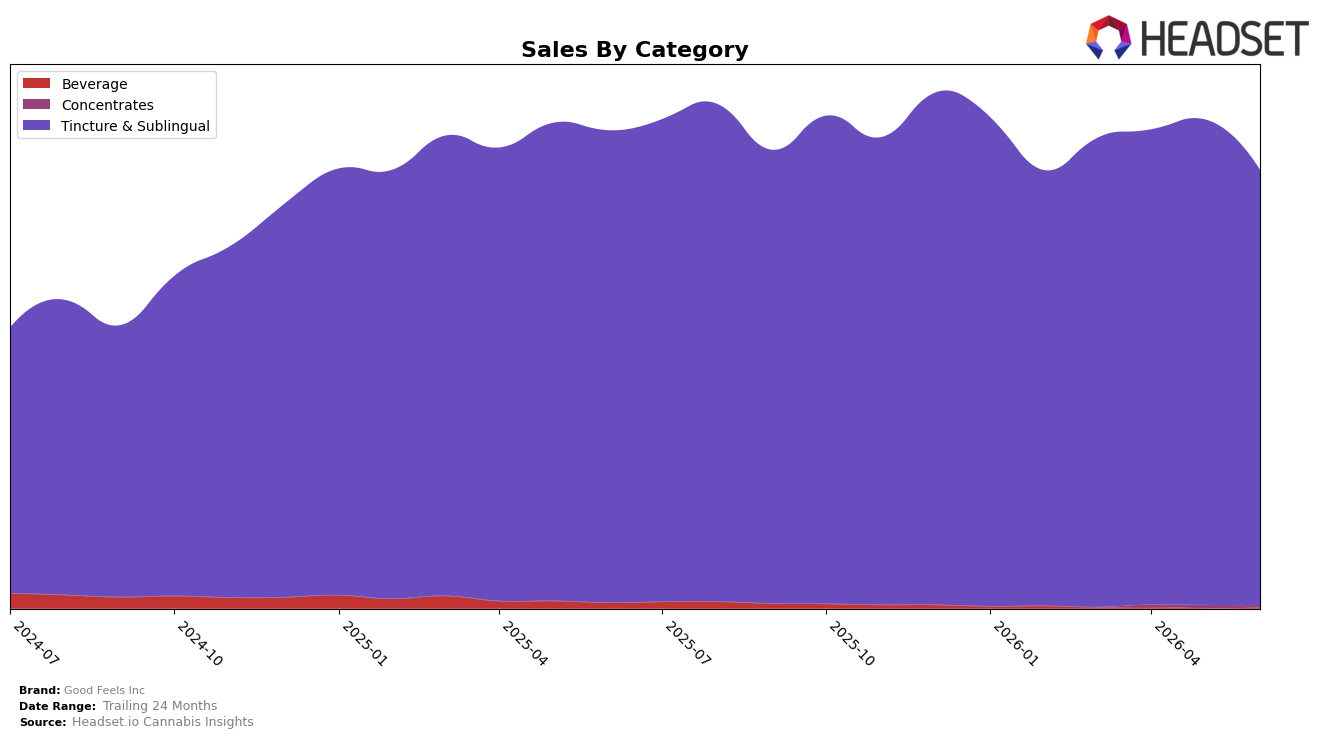
Good Feels Inc concentrated 99.37% of June 2026 sales in Tincture & Sublingual, where sales declined 7.83% year over year and 10.36% month over month, while overall brand sales were down 8.28% year over year and average price slipped 0.27%. Peripheral categories were volatile but tiny: Concentrates held 0.46% share with a 24.97% month-over-month drop and no year-over-year basis, and Beverage sat at 0.17% share with an 86.25% year-over-year decline but a 338.19% month-over-month rebound; the mix implies a near-single category identity that amplifies exposure to Tincture & Sublingual swings more than a diversified peer would.
Within Tincture & Sublingual, the brand’s rank of 1 in Massachusetts offsets some of the 10.36% month-over-month and 7.83% year-over-year category-specific declines by signaling entrenched shelf position at current average prices of $46.17. The combination of a 99.37% mix weight and a modest 0.27% brand-wide price decrease suggests the path to stabilizing the 8.28% year-over-year sales dip rests more on mix and velocity than on price cuts, while the 338.19% month-over-month Beverage spike at 0.17% share and the 24.97% month-over-month slide in 0.46% share Concentrates indicate experiments that can supply incremental growth without jeopardizing the core; taken together, the pattern points to a category-led positioning strategy where limited, controlled expansion is the lever for risk reduction.
Competitive Landscape
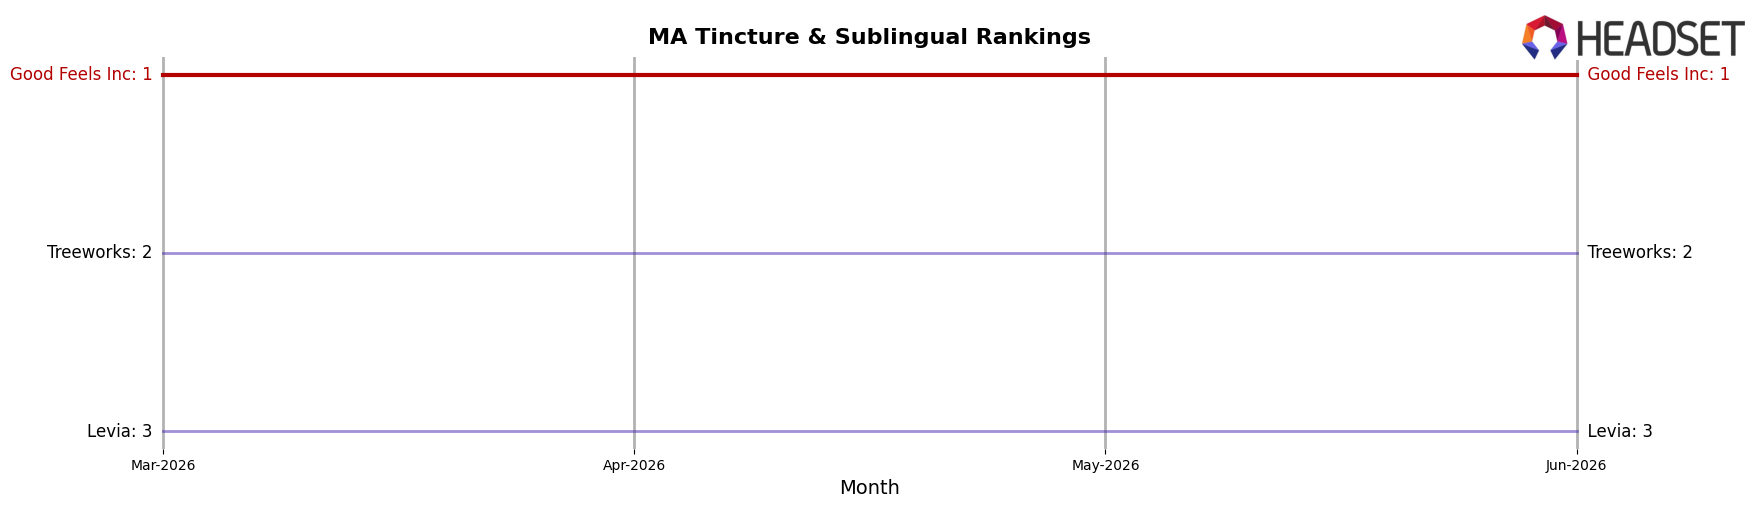
Good Feels Inc sits at rank #1 in MA Tincture & Sublingual in June 2026, unchanged from #1 in June 2025, while also holding #1 in March 2026; Treeworks remains #2 YoY and in June 2026, and Levia holds #3 both YoY and in June 2026 despite a 126.68% YoY sales increase. The stability at #1 alongside competitors posting sizable YoY growth—such as Squier's Elixirs rising in rank from #10 to #5 with 166.66% YoY growth and Howl's remaining #4 with 22.60% YoY growth—implies Good Feels Inc’s lead is defended by share retention rather than rank volatility and that future risk concentrates in fast-advancing challengers rather than current position slippage.
Notable Products
Good Vibez Plus- Grape Syrup Tincture (500mg THC, 30ml, 1oz) posted the steepest decline at -49.95% while holding rank 9, contrasting with Good Vibez X - Unflavored Syrup Tincture (1000mg THC, 30ml) up 128.86% at rank 3, and Good Vibez X - Cherry Limeade Fast Acting Syrup Tincture (1000mg THC, 30ml, 1oz) rising 26.25% at rank 5. The top rank holder, Good Vibez X - Pink Lemonade Syrup Tincture (1000mg THC, 30ml, 1oz), fell -29.30% at rank 1, while Good Vibes - Watermelon Fast Acting Syrup Tincture (500mg THC, 30ml, 1oz) slipped -17.26% at rank 6. With all ten top SKUs concentrated in Tincture & Sublingual and higher-dosage X variants mixing sharp gains with sharp losses, the pattern implies a shift toward potency-led winners but with flavor volatility that requires pruning lower-velocity 500mg line items to protect mix quality.
Top Selling Cannabis Brands
Data for this report comes from real-time sales reporting by participating cannabis retailers via their point-of-sale systems, which are linked up with Headset’s business intelligence software. Headset’s data is very reliable, as it comes digitally direct from our partner retailers. However, the potential does exist for misreporting in the instance of duplicates, incorrectly classified products, inaccurate entry of products into point-of-sale systems, or even simple human error at the point of purchase. Thus, there is a slight margin of error to consider. Brands listed on this page are ranked in the top twenty within the market and product category by total retail sales volume.

