.svg)

Jun-2026
Sales
Trend
6-Month
Product Count
SKUs
Avg Price
YoY Sales Change
YoY Price Change


Market Insights Snapshot
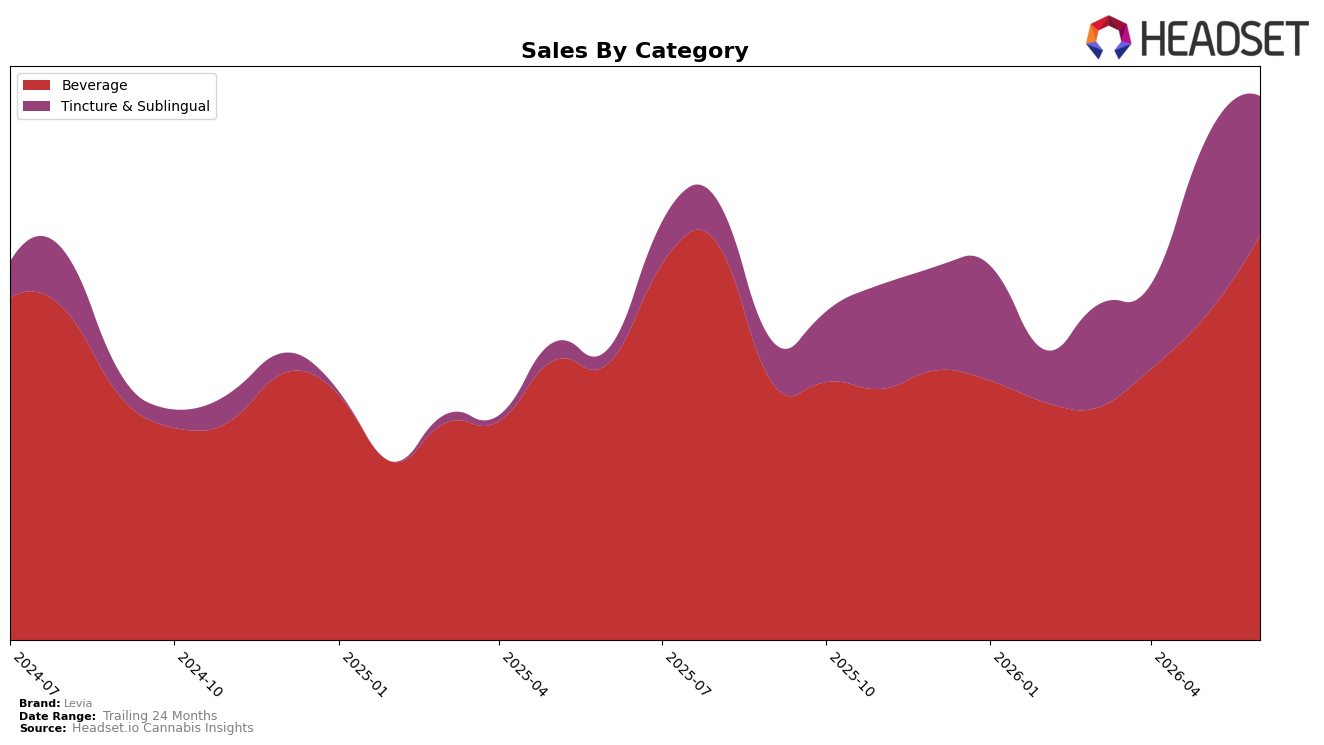
Levia’s category mix in June 2026 tilted 68.61% toward Beverage with a 35.45% year-over-year lift and a 20.18% month-over-month gain, while Tincture & Sublingual held 31.39% share with a 126.68% year-over-year surge but a -13.78% month-over-month pullback. Average prices diverged sharply at $5.01 in Beverage versus $58.30 in Tincture & Sublingual, coinciding with a 55.04% brand-level year-over-year sales increase and an 8.88% rise in average price; the pattern implies volume-led growth is consolidating in Beverage even as high-ticket Tincture & Sublingual drives disproportionate annual gains but faces short-term demand elasticity.
Holding rank 1 in Beverage in Massachusetts alongside a 20.18% month-over-month Beverage increase and a -13.78% month-over-month decline in Tincture & Sublingual implies Levia’s positioning is anchored in repeatable, lower-price Beverage velocity while premium drops expand the addressable ticket size on a longer horizon. With June 2026 share at 68.61% in Beverage and 31.39% in Tincture & Sublingual, the trade-off suggests near-term gains accrue fastest where rank leadership already converts traffic, while sustaining the 126.68% year-over-year Tincture & Sublingual growth will require mitigating price-sensitivity headwinds that constrained month-over-month sell-through.
Competitive Landscape
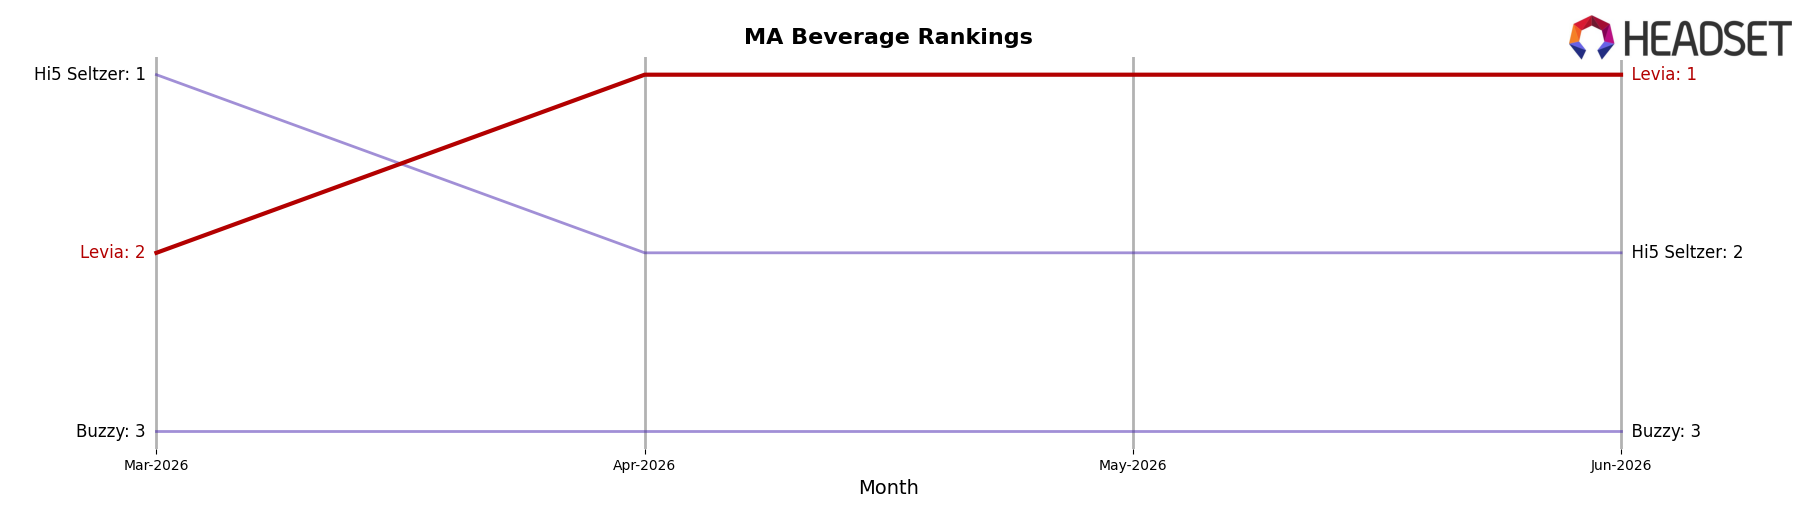
Levia is ranked #1 in MA Beverage in June 2026, unchanged year over year at #1, after improving from #2 three months prior to reach its peak rank of #1 in June 2026; by contrast, Hi5 Seltzer holds #2 with a 31.9% YoY sales increase while remaining flat at #2, and Buzzy sits at #3 with a -15.9% YoY sales decline and no rank change at #3. Additional pressure comes from Pine + Star climbing from #5 to #4 on 13.3% YoY sales growth while Squier's Elixirs moved from #6 to #5 with 19.0% YoY growth, indicating that Levia’s flat YoY rank at #1 alongside a recent three-month rise from #2 suggests leadership is being maintained but defended against faster-rising challengers just below the top spot.
Notable Products
Achieve - Poolside Pop Seltzer (5mg THC, 12oz) posted the standout move in June 2026 with +258% month over month to rank 2, while Achieve - Mimosa Sativa Seltzer (5mg THC, 12oz) dropped 62% MoM to rank 10, marking a sharp bifurcation within the Achieve line. Dream - Indica Jam Berry Seltzer (5mg THC, 12oz) held rank 1 with a modest +2.9% MoM, as Achieve- Kowloon Scorpion Bowl Seltzer (5mg THC, 12oz) surged +95% MoM into rank 6, indicating momentum concentrated in limited-time or flavor-forward Achieve variants. With all top-10 positions in the Beverage category and four Achieve SKUs inside the top seven, the mix signals Levia is tilting toward sativa-forward and seasonal Achieve offerings at the expense of slower core extensions, pointing to a portfolio that prioritizes high-velocity novelty over breadth.
Top Selling Cannabis Brands






Data for this report comes from real-time sales reporting by participating cannabis retailers via their point-of-sale systems, which are linked up with Headset’s business intelligence software. Headset’s data is very reliable, as it comes digitally direct from our partner retailers. However, the potential does exist for misreporting in the instance of duplicates, incorrectly classified products, inaccurate entry of products into point-of-sale systems, or even simple human error at the point of purchase. Thus, there is a slight margin of error to consider. Brands listed on this page are ranked in the top twenty within the market and product category by total retail sales volume.

