.svg)


Market Insights Snapshot
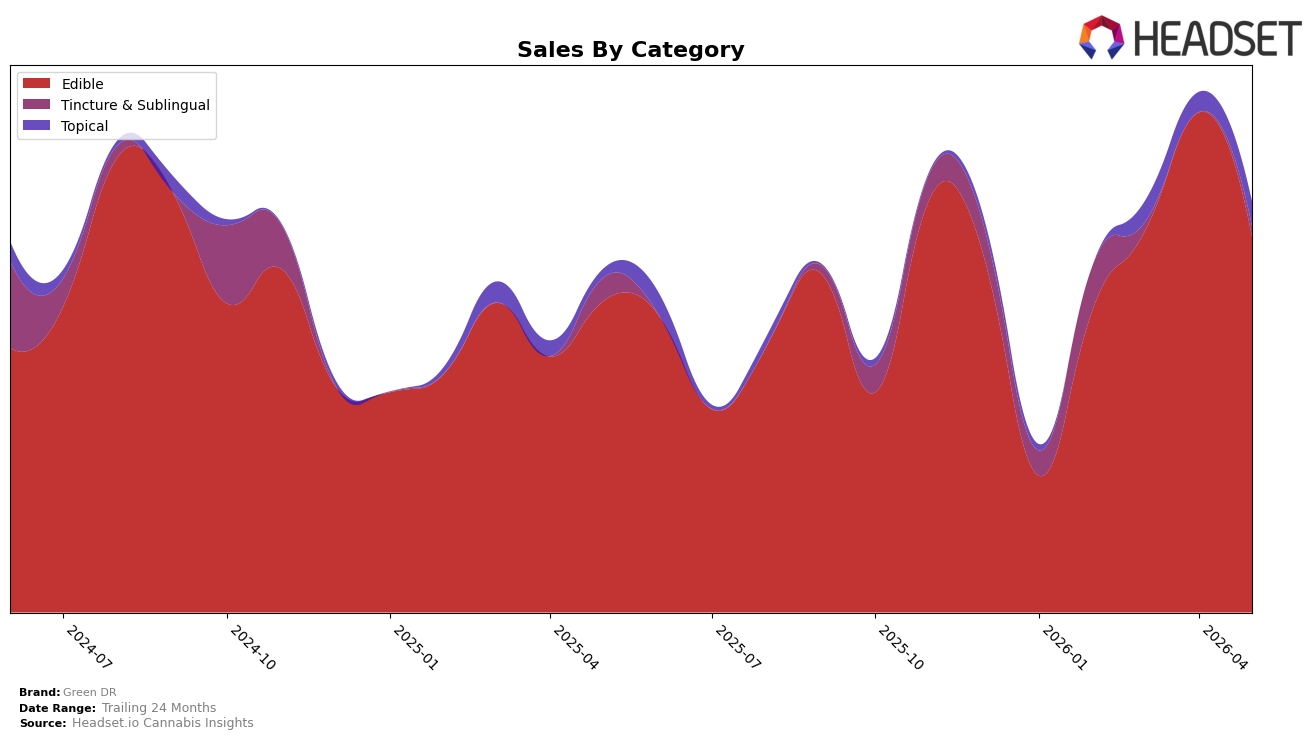
Edible held 91.58% share in May 2026 with a 20.64% year-over-year lift but a 24.88% month-over-month drop, while Topical rose to 5.91% share on 178.92% year-over-year growth and a 22.60% month-over-month gain; Tincture & Sublingual slid to 2.51% share with a 55.14% year-over-year decline and no recorded month-over-month change. Against brand-level sales up 19.57% year over year and an average price up 6.49%, Edible’s higher average price of $36.48 versus the brand’s $28.39 suggests mix tilting toward higher-priced units even as volume likely softened month over month; this pattern implies Green DR is leaning on Edible for growth year over year while ceding near-term momentum to faster-growing but smaller Topical.
With Topical expanding 178.92% year over year and 22.60% month over month alongside Edible’s 24.88% month-over-month contraction, the brand’s positioning is shifting toward a broader wellness-oriented basket that can absorb volatility in the core Edible line; the 5.91% Topical share now acts as a buffer against single-category swings. In Michigan, Edible category rank data are unavailable, but the combination of a 20.64% Edible year-over-year gain and a 55.14% Tincture & Sublingual year-over-year decline indicates Green DR is consolidating where pricing power exists while pruning underperforming formats, implying a strategy to protect share via premiumized Edibles and selectively nurture Topical to stabilize month-to-month comps.
Competitive Landscape
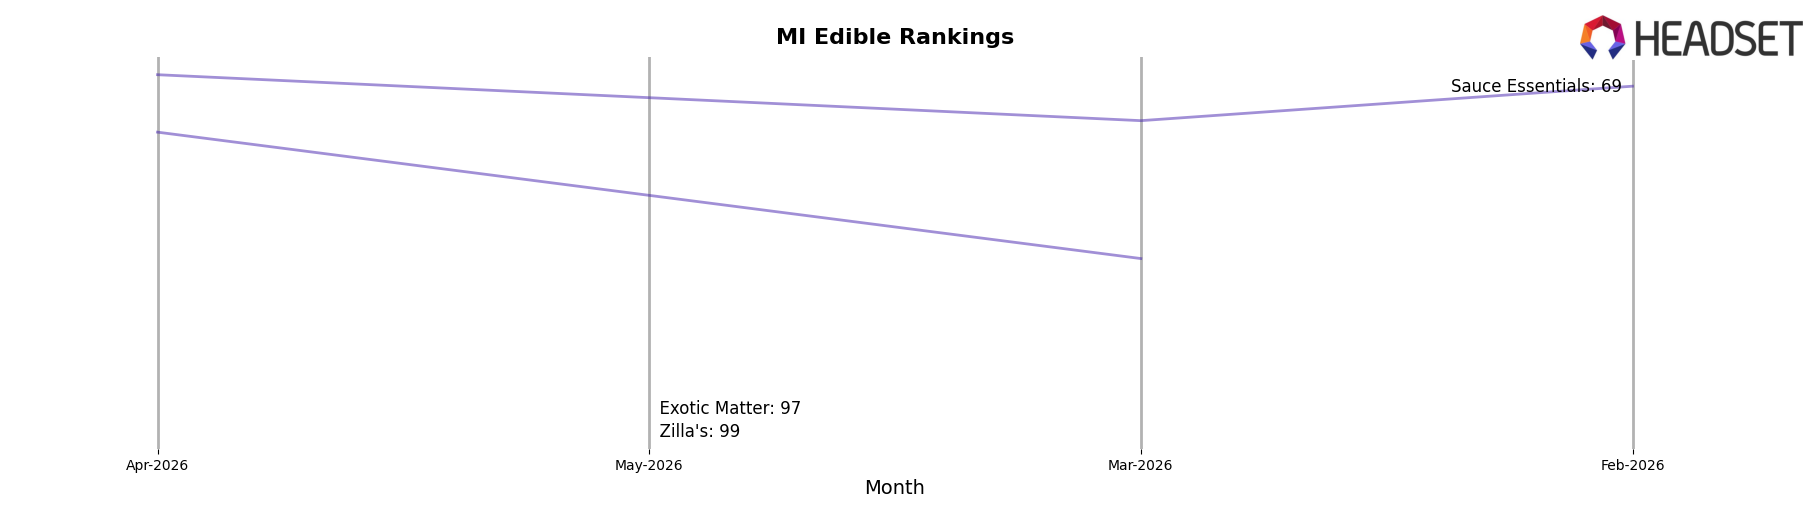
Green DR is ranked #100 in MI Edible in May 2026, up 13 positions from #113 year over year, and 16 positions above February 2026’s #116; the brand also briefly peaked at #97 in April 2026, a 3-rank lift from the current spot. Among competitors, Wyld held #1 with a -17.0% year-over-year sales change while Camino advanced from #5 to #4 with a 14.1% sales increase, indicating that Green DR’s gradual rank improvement is occurring while the category’s leaders are either contracting or selectively gaining, which implies the brand’s trajectory is tied more to churn at the top than to outperformance within its immediate rank band.
Notable Products
CBD Dog Treats 10-Pack (300mg CBD) posted the steepest month-over-month decline at -58.8% in May 2026, sliding outside the upper ranks while the category mix tilted toward human-focused formats. At the top, CBD/CBG/CBG Trifecta Pain Relief Gummies 30-Pack (900mg CBD, 600mg CBN, 900mg CBG) held rank 1 despite a -10.6% drop and generated $5,078, while CBD/CBN/CBG Trifecta Pain Relief Gummies 10-Pack (300mg CBD, 200mg CBN, 300mg CBG) fell -42.9% at rank 3. With three of the top five SKUs in Edible and two of those posting double-digit declines, the mix points to demand consolidating in flagship gummy formats but with price-pack and size sensitivity reshaping velocity.
Top Selling Cannabis Brands






Data for this report comes from real-time sales reporting by participating cannabis retailers via their point-of-sale systems, which are linked up with Headset’s business intelligence software. Headset’s data is very reliable, as it comes digitally direct from our partner retailers. However, the potential does exist for misreporting in the instance of duplicates, incorrectly classified products, inaccurate entry of products into point-of-sale systems, or even simple human error at the point of purchase. Thus, there is a slight margin of error to consider. Brands listed on this page are ranked in the top twenty within the market and product category by total retail sales volume.

