Jan-2026
Sales
Trend
6-Month
Product Count
SKUs
Avg Price
YoY Sales Change
YoY Price Change
Market Insights Snapshot
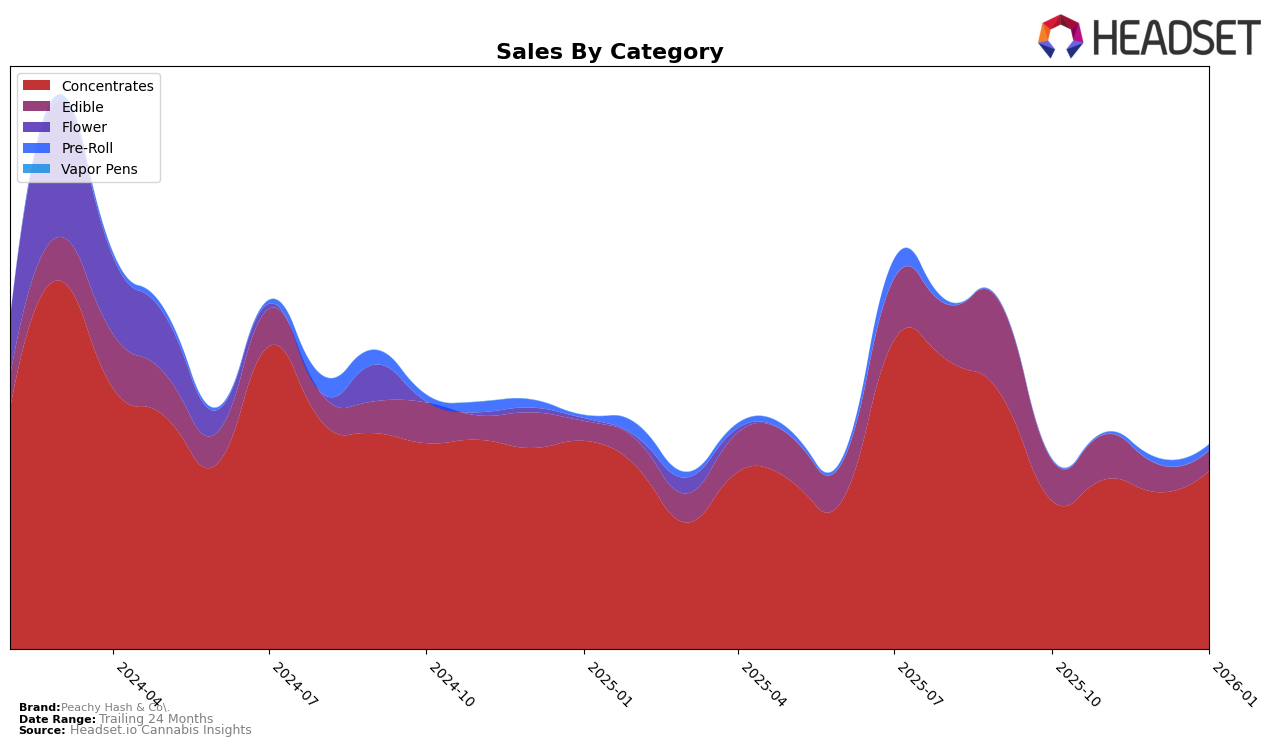
In the Michigan market, Peachy Hash & Co. has shown notable progress in the Concentrates category. Their rank improved from 26th in October 2025 to 21st by January 2026. This upward trend is indicative of a positive reception and growing market presence in this category. The brand's sales figures in Concentrates also reflect this growth, with a significant increase from October to January. However, in the Edibles category, Peachy Hash & Co. did not manage to break into the top 30 rankings, which suggests that there may be challenges or increased competition in this segment.
The performance of Peachy Hash & Co. across categories in Michigan reveals a contrasting picture. While they have made strides in Concentrates, the Edibles category has seen a decline in rankings from 75th in October 2025 to 90th by January 2026. This drop, coupled with decreasing sales figures, points to potential hurdles that the brand may need to address to regain its standing. The disparity between their performance in Concentrates and Edibles highlights areas of opportunity for Peachy Hash & Co. to strategize and potentially reallocate resources to strengthen their presence in the less successful category.
Competitive Landscape
In the competitive landscape of the Michigan concentrates market, Peachy Hash & Co. has shown a dynamic performance over the past few months. Starting in October 2025, Peachy Hash & Co. was ranked 26th, but by January 2026, it had improved its position to 21st. This upward trajectory is notable, especially when compared to competitors like Common Citizen and GreenCo Ventures, both of which have experienced fluctuations in their rankings. For instance, GreenCo Ventures dropped from 15th in December 2025 to 23rd in January 2026, while Common Citizen fell from 16th to 20th in the same period. Meanwhile, Apex Solventless (MI) has maintained a relatively stable position, slightly ahead of Peachy Hash & Co. at 19th in January 2026. Despite these challenges, Peachy Hash & Co.'s ability to climb the ranks suggests a positive trend in sales performance, indicating a potential for further growth in the competitive Michigan concentrates market.

Notable Products
In January 2026, the top-performing product for Peachy Hash & Co. was Citrus Berry Live Rosin Gummies 20-Pack (200mg) in the Edible category, ascending to the number one rank despite a decrease in sales to 644 units. Cherry Live Rosin Gummies 20-Pack (200mg) maintained its position at second place, while Blue Raspberry Live Hash Rosin Gummies 20-Pack (200mg) experienced a significant drop from first place in December to fifth. The newly introduced Chocolope Live Rosin (1g) made its debut at the third position in the Concentrates category. Strawberry Live Rosin Gummies 20-Pack (200mg) held steady at fourth place, showing consistent performance over the past months.
Top Selling Cannabis Brands
Data for this report comes from real-time sales reporting by participating cannabis retailers via their point-of-sale systems, which are linked up with Headset’s business intelligence software. Headset’s data is very reliable, as it comes digitally direct from our partner retailers. However, the potential does exist for misreporting in the instance of duplicates, incorrectly classified products, inaccurate entry of products into point-of-sale systems, or even simple human error at the point of purchase. Thus, there is a slight margin of error to consider. Brands listed on this page are ranked in the top twenty within the market and product category by total retail sales volume.

