Market Insights Snapshot
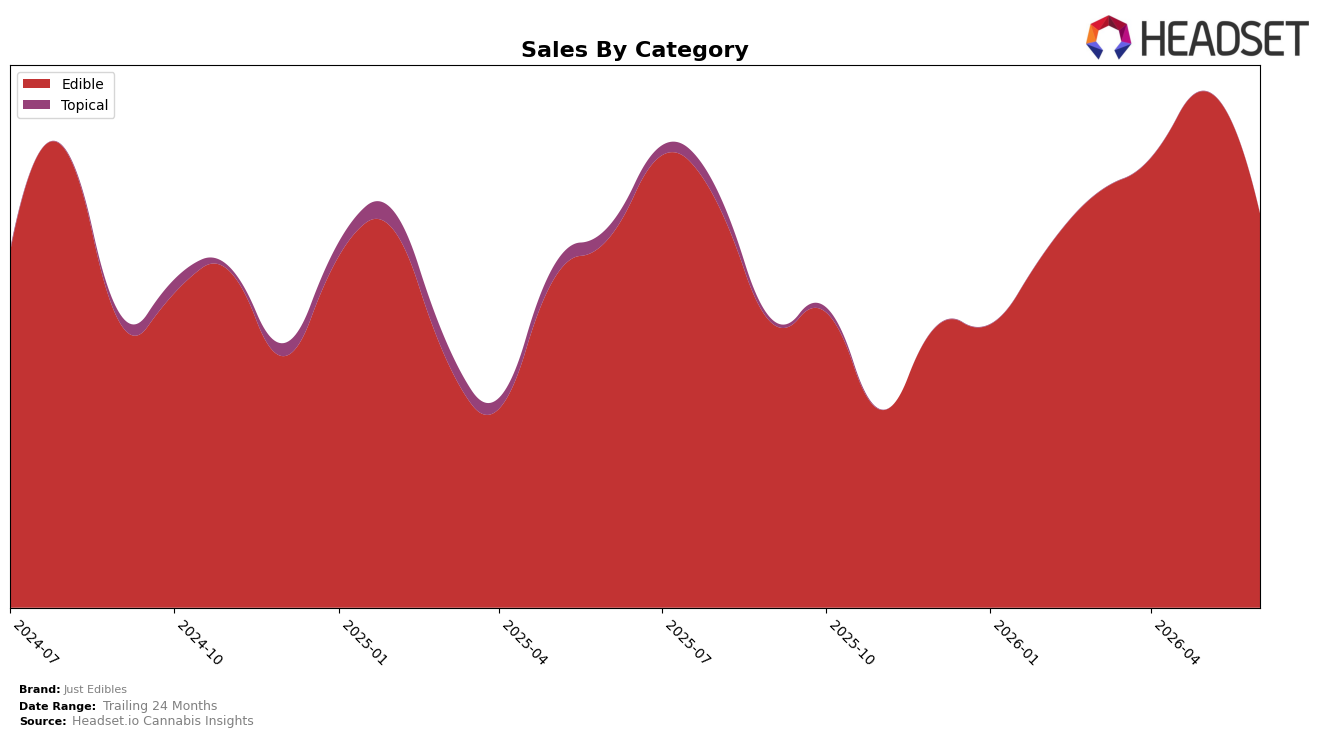
In June 2026, Just Edibles operated as a single-category brand, with Edible holding 100.0% of sales mix and ranking 15 in the Edible category in Nevada. Within this concentration, Edible sales were up 6.9% year over year while declining 23.7% month over month, and the brand’s overall sales grew 3.6% YoY against a 17.96% YoY drop in average price to $9.49. The pattern implies the brand is trading volume for price within one category, benefiting annual unit gains but leaving monthly momentum exposed when promotions or seasonal pullbacks hit.
The mix being 100.0% Edible with a 24‑month sales change of -12.0% and a current category rank of 15 suggests limited diversification is capping rank mobility even as June 2026 YoY growth of 6.9% in Edible provides some lift. The 23.7% MoM decline alongside a 17.96% YoY price compression indicates elasticity-driven share defense rather than expanded category footprint, which implies the near-term positioning relies on promotional depth and seasonal cadence rather than cross-category buffer or up-tier pricing power.
Competitive Landscape
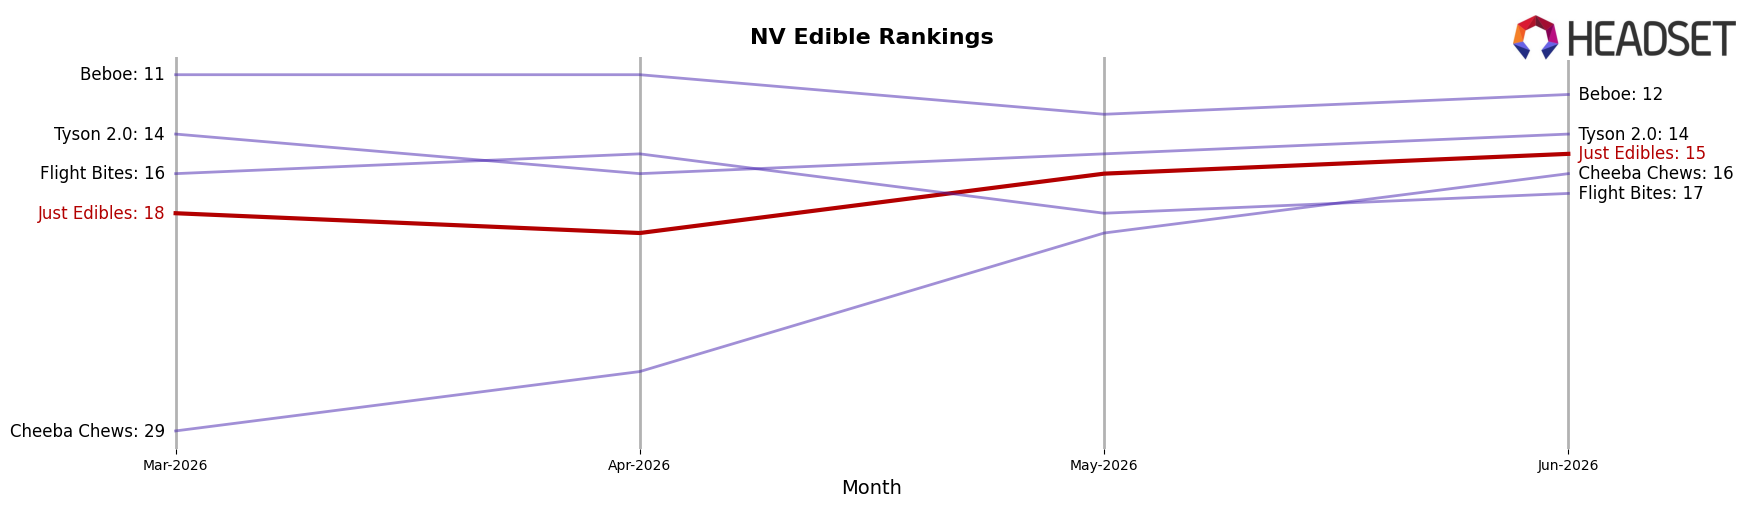
Just Edibles sits at rank #15 in Nevada Edible for June 2026, improving 2 positions from #17 year over year and 3 positions from #18 in March 2026, while also matching its peak rank of #15 in June 2026; in contrast, Wyld held at #1 year over year despite a -1.9% sales decline and Kanha / Sunderstorm surged from #9 to #3 alongside a 191.2% sales increase, indicating that Just Edibles’ incremental rank gains amid both flat leaders and rapidly ascending challengers reflect a stabilization play rather than breakout momentum.
Notable Products
Blue Raspberry Sour Belt Gummies 10-Pack (100mg) posted the steepest contraction in June 2026, down 41.5% MoM and sitting at rank 5, while Fruit Punch Long Sour Belt Gummies (100mg) fell 29.3% at rank 3; together with Cheese Crackers 20-Pack (100mg) down 29.3% at rank 4, the mid-table retrenchment indicates belt-style gummies are losing velocity even as they retain multiple top-10 slots. In contrast, Graham Cracker Peanut Butter Cookie Cream Sandwich 10-Pack (100mg) rose 38.2% MoM to rank 1 with $9,727 in sales, while Birthday Cake Cookie Cream Sandwich 10-Pack (100mg) slid 37.3% at rank 2, and at least six of the top ten are Sour Belt gummy SKUs, concentrating the portfolio in one format despite divergent trajectories. The pattern implies Just Edibles is leaning on a cookies-and-belts barbell where the lead cookie SKU gains share while several belt variants contract, signaling a need to rebalance flavor mix and pack strategy within belts rather than expanding the format count.
Top Selling Cannabis Brands
Data for this report comes from real-time sales reporting by participating cannabis retailers via their point-of-sale systems, which are linked up with Headset’s business intelligence software. Headset’s data is very reliable, as it comes digitally direct from our partner retailers. However, the potential does exist for misreporting in the instance of duplicates, incorrectly classified products, inaccurate entry of products into point-of-sale systems, or even simple human error at the point of purchase. Thus, there is a slight margin of error to consider. Brands listed on this page are ranked in the top twenty within the market and product category by total retail sales volume.

