.svg)

Sep-2026
Sales
Trend
6-Month
Product Count
SKUs
Avg Price
YoY Sales Change
YoY Price Change


Where to Buy
Gron / Grön is stocked at 1,766 licensed dispensaries across Oregon, New York, and 13 other states, 377 of them in Oregon, with the deepest coverage in Portland, Eugene, Salem, Bend, and Medford. Search by ZIP code or city below to find the closest one, or filter by product type if you are after a specific format.
Market Insights Snapshot
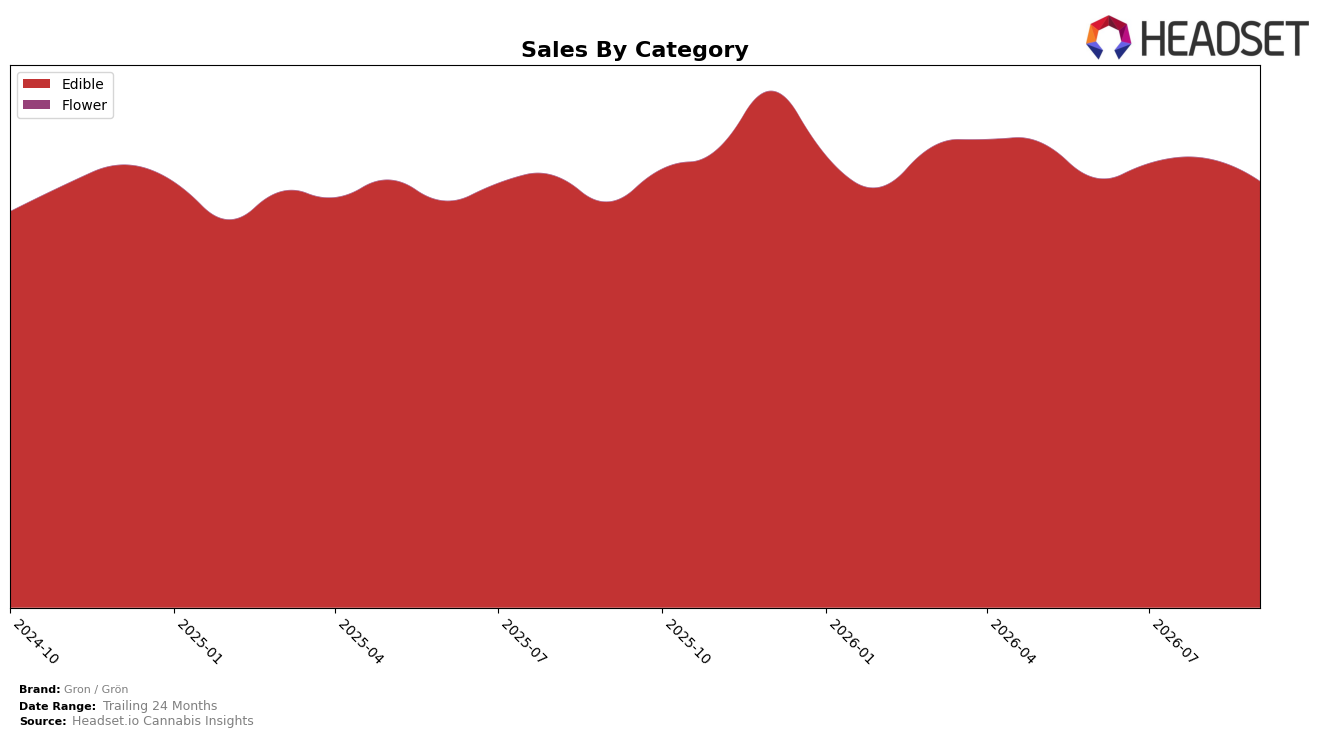
In September 2026, Gron / Grön remained a single-category brand with Edible at 100.0% of sales share, pairing a 5.08% year-over-year sales increase with a -5.14% month-over-month contraction, while average price climbed 2.87% YoY alongside a full-category concentration at rank 1 in Edible within New Jersey. With brand-level sales up 5.08% YoY and average price at $10.14, the concentration in Edible and the negative MoM slope imply a pullback after earlier summer peaks, suggesting demand is leaning toward stable yearly retention rather than monthly expansion.
Holding a 100.0% mix in Edible while achieving rank 1 in New Jersey and a 5.08% YoY gain—despite a -5.14% MoM dip—signals that positioning is anchored in a single-vertical depth rather than cross-category breadth, trading diversification risk for top-of-shelf visibility. The 2.87% YoY price lift coexisting with a full Edible concentration and September rank leadership indicates pricing power is being exercised through product depth, implying that future share stability will depend on sustaining Edible-specific velocity more than portfolio expansion.
Competitive Landscape
Gron / Grön sits at rank #2 in Oregon Edible for September 2026, unchanged from #2 in September 2025, and it has also held #2 across the last three months, implying flat rank momentum despite reaching its peak position in September 2026. In contrast, Wyld remained #1 YoY while growing sales by 4.3%, and Good Tide held at #4 with a 9.4% YoY sales decline, indicating that the main pressure on Gron / Grön is from the leader rather than from challengers slipping behind. With Drops static at #3 and down 0.5% YoY, the competitive gap looks anchored above rather than below, so the stable #2 rank points to a need for share capture from the top competitor rather than defense against mid-pack brands.

Notable Products
Passion Orange Guava Mega Pearl Rosin Gummy (100mg) posted the steepest decline at -11.1% and slid to rank 9, while Pearls - CBG/THC 3:1 Blue Razzleberry Gummies 5-Pack (30mg CBG, 10mg THC) inched up +1.1% to hold rank 1, indicating a mix shift away from single-flavor Mega formats toward Pearls. CBD/CBN/THC 1:1:1 Blackberry Lemonade Pearls Gummies 5-Pack (10mg CBD, 10mg CBN, 10mg THC) surged +10.6% at rank 2 as CBN/THC 4:1 Strawberry Melon Pearls Gummies 5-Pack (40mg CBN, 10mg THC) rose +10.9% at rank 3, and five of the top ten are Pearls SKUs, concentrating demand in smaller 5-Pack functional blends. The 10-Pack Sleepy Blackberry Lemonade Sugar Coated Pearl Gummies (100mg CBD, 100mg CBN, 100mg THC) dipped -6.1% at rank 5 despite leading the dollar pool at $1,003,047, while the 10-Pack CBG/THC 3:1 Sativa Daytime format fell -2.6% at rank 6, suggesting larger-count packs are ceding momentum to targeted micro-pack use-cases. Together these moves imply Gron / Grön’s commercial direction is tilting toward CBN/CBG-forward Pearls in 5-Pack sizes that convert on functional need states rather than bulk quantity.
Top Selling Cannabis Brands






Data for this report comes from real-time sales reporting by participating cannabis retailers via their point-of-sale systems, which are linked up with Headset’s business intelligence software. Headset’s data is very reliable, as it comes digitally direct from our partner retailers. However, the potential does exist for misreporting in the instance of duplicates, incorrectly classified products, inaccurate entry of products into point-of-sale systems, or even simple human error at the point of purchase. Thus, there is a slight margin of error to consider. Brands listed on this page are ranked in the top twenty within the market and product category by total retail sales volume.

