Jun-2026
Sales
Trend
6-Month
Product Count
SKUs
Avg Price
YoY Sales Change
YoY Price Change
Market Insights Snapshot
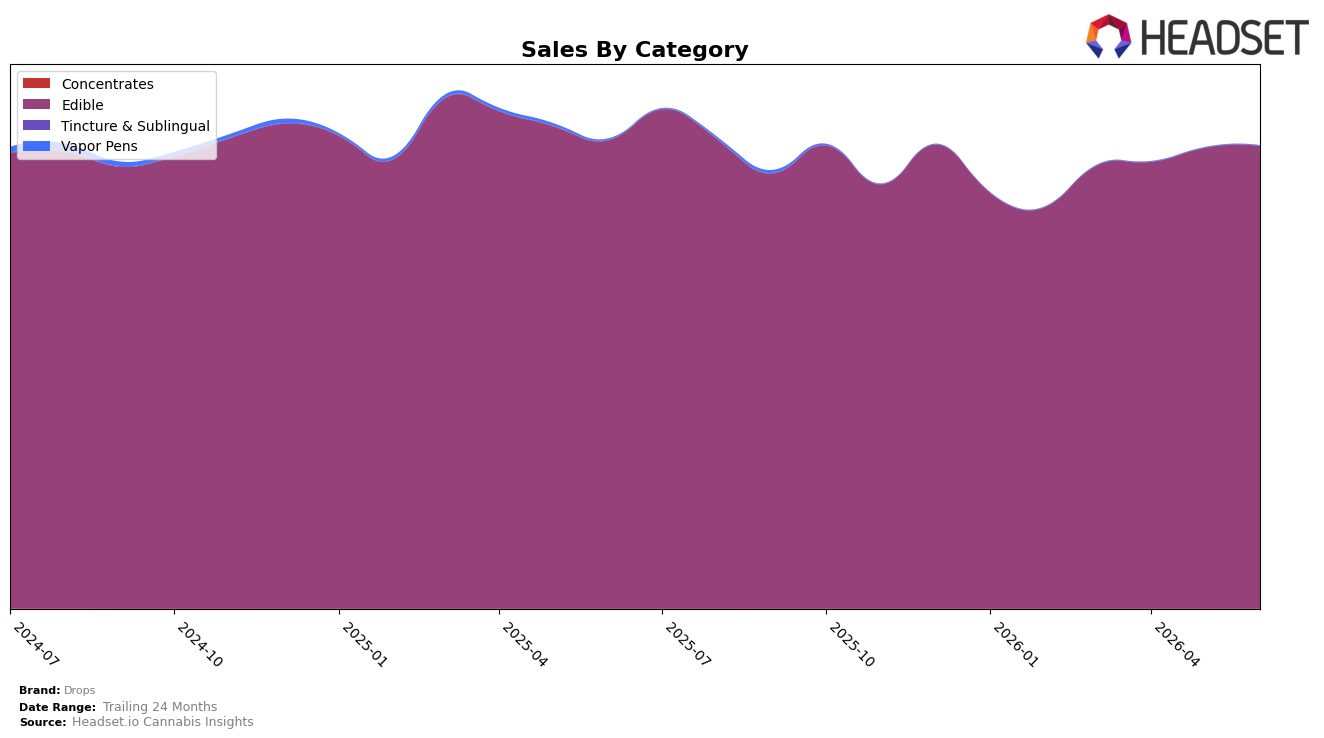
In June 2026, Drops concentrated entirely in Edible with a 100.0% category mix, pairing a brand-level year-over-year sales change of -1.4% with an Edible-specific year-over-year change of -1.2%. Month over month, Edible sales rose 0.4% while average price increased 1.5% year over year, indicating slight pricing firmness alongside a narrow volume drag. Drops held rank 3 in Edible in Oregon, and the brand’s 24-month sales change of 3.6% contrasts with the current -1.4% year-over-year dip, implying a longer-cycle base that is stable but currently flattening.
This single-category concentration, combined with a 0.4% month-over-month lift against a -1.2% year-over-year decline, implies reliance on short-cycle promotional or distribution pulses rather than broad portfolio tailwinds. Maintaining rank 3 in Edible in Oregon while average price is up 1.5% suggests that share defense is tied to price points and pack architecture; without diversification beyond Edible’s 100.0% mix, future gains likely depend on tightening price-to-value or expanding within Edible subsegments to counter the -1.4% brand-level year-over-year pressure.
Competitive Landscape
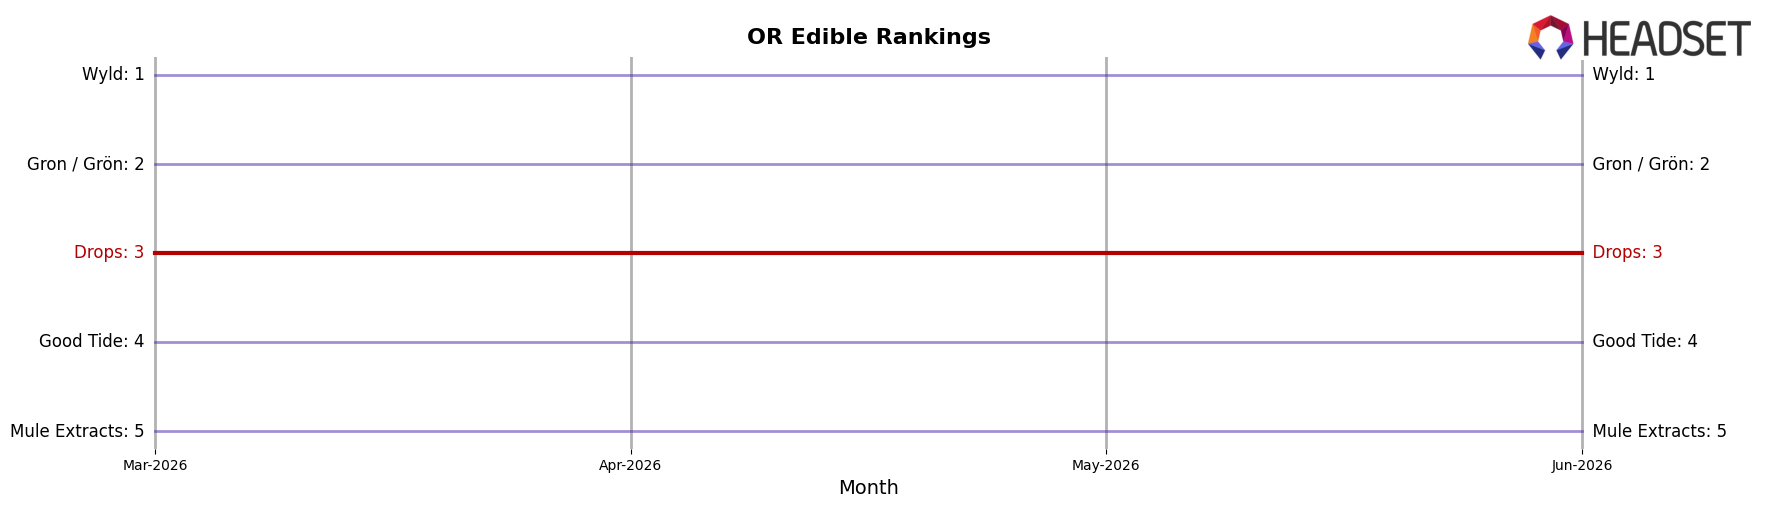
Drops sits at rank #3 in Oregon Edible for June 2026, unchanged from #3 year over year, and unchanged from #3 in March 2026; this flat rank stability contrasts with Wyld holding #1 with a 45.3% year-over-year sales increase while Gron / Grön remains #2 despite a 104.6% year-over-year sales decline, and Good Tide stays #4 with an 88.9% year-over-year lift relative to Mule Extracts at #5 and down 11.6% year over year; the pattern implies that Drops’ unbroken #3 position in June 2026 and across the last three months is the result of offsetting competitor volatility—Wyld widening the gap above and Good Tide accelerating below—so maintaining #3 likely depends more on defending against upward pressure from fast-growing #4 than on catching a contracting #2.
Notable Products
Active - Lemon Live Rosin Jellies 2-Pack (100mg) posted the steepest decline at -9.7% month over month and slipped to rank 4, while the category leader CBN/CBD/THC 1:1:1 Black Currant Rosin Gummies 20-Pack (100mg CBN, 100mg CBD, 100mg THC) held rank 1 despite a -2.3% dip. In contrast, CBD/THC 2:1 Blackberry Soothing Solventless Rosin Jellies 20-Pack (200mg CBD, 100mg THC) advanced with +8.7% MoM at rank 5 as Lime Live Rosin Gummies 20-Pack (100mg) added +8.5% at rank 7. Nine of the top ten are Edible SKUs, and two new 2-packs with no prior month data entered at ranks 8 and 10, implying a shift toward smaller pack trial alongside sustained dominance of functional rosin formats.
Top Selling Cannabis Brands
Data for this report comes from real-time sales reporting by participating cannabis retailers via their point-of-sale systems, which are linked up with Headset’s business intelligence software. Headset’s data is very reliable, as it comes digitally direct from our partner retailers. However, the potential does exist for misreporting in the instance of duplicates, incorrectly classified products, inaccurate entry of products into point-of-sale systems, or even simple human error at the point of purchase. Thus, there is a slight margin of error to consider. Brands listed on this page are ranked in the top twenty within the market and product category by total retail sales volume.

