Jun-2026
Sales
Trend
6-Month
Product Count
SKUs
Avg Price
YoY Sales Change
YoY Price Change
Market Insights Snapshot
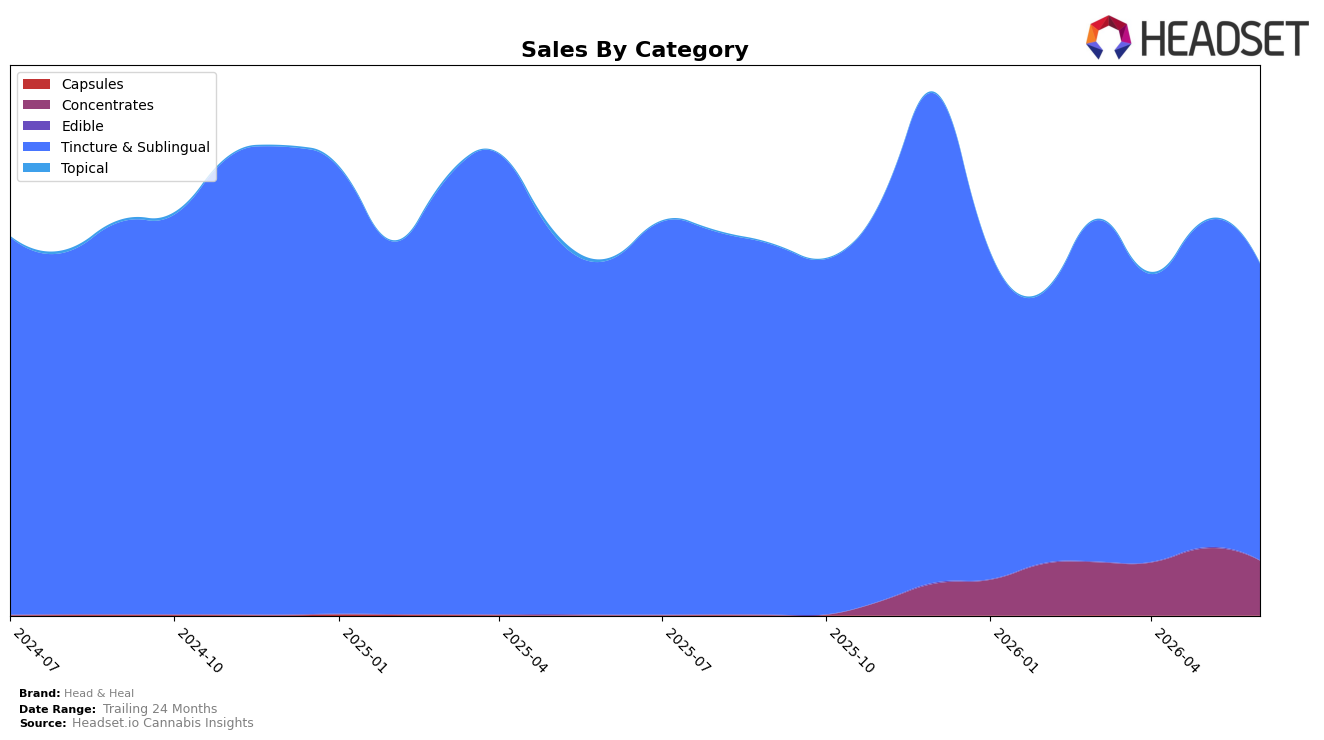
Head & Heal remained concentrated in Tincture & Sublingual at 84.35% share in June 2026, with that anchor category down 16.32% year over year and 8.88% month over month, while Concentrates held 15.49% share with a sharper 18.38% month-over-month decline and no year-over-year comp reported. Topical was a negligible 0.16% share with steep drops of 68.50% year over year and 52.38% month over month, and average price across the brand fell 10.36% year over year to $76.79. Despite overall brand sales contracting 1.28% year over year, Head & Heal held a number 2 rank in Tincture & Sublingual in New York, implying the brand is defending placement even as volume softens and mix narrows.
The pattern suggests a deliberate consolidation around Tincture & Sublingual where Head & Heal’s number 2 rank in New York indicates pricing power may be limited as the 10.36% year-over-year price drop coincides with an 8.88% month-over-month and 16.32% year-over-year volume pullback in that category. With Concentrates at 15.49% share but falling 18.38% month over month, and Topical retreating to 0.16% share after a 52.38% month-over-month and 68.50% year-over-year decline, the brand’s positioning skews toward depth in one category rather than diversification; the implication is that stabilizing Tincture & Sublingual conversion matters more for near-term share than expanding smaller formats.
Competitive Landscape
Head & Heal sits at rank #2 in New York Tincture & Sublingual for June 2026, unchanged YoY from #2, while its peak at #1 in December 2024 underscores a shift from leadership to a stable runner-up position; in the same June 2026 view, Ayrloom holds #1 with a 16.5% YoY sales increase and Mfny (Marijuana Farms New York) remains at #3 with a 22.8% YoY sales decline, indicating the gap above is buoyed by competitor growth while pressure from below is softened. Compared with three months prior at #2, the flat rank trend contrasts with Veterans Choice Creations (VCC) improving from #5 YoY to #4 and OMO - Open Minded Organics rising from #7 YoY to #5, implying Head & Heal’s consistent #2 position is increasingly reliant on holding share as ascendant mid-pack rivals close in.

Notable Products
CBD Medium Dog Oil Tincture (600mg CBD, 30ml) posted the largest movement in June 2026 with +102.6% MoM and climbed to rank 6, while CBD Organic Full Spectrum Tincture (1200mg CBD, 30ml) also surged +72.3% MoM at rank 7; by contrast, CBD Small Dog Tincture (300mg CBD, 30ml) fell -47.0% MoM to rank 8. Max Strength THC Tincture (1000mg THC, 30ml, 1oz) held rank 1 despite a -4.2% MoM slip, and CBD/THC/CBN 2:1:2 Sleep Tincture (600mg CBD, 300mg THC, 600mg CBN, 30ml) dropped -17.3% MoM at rank 2, indicating that high-volume human tinctures still anchor revenue even as pet and CBD-only tinctures rebound. With four of the top five SKUs in Tincture & Sublingual and one Concentrates SKU at rank 3 declining -18.4% MoM, the assortment is consolidating around ingestible formats rather than inhalables. The pattern implies Head & Heal is shifting mix toward value and niche tincture segments (including pet and CBD-forward) while defending flagship THC-led positions, a balance that could buffer volatility across price tiers.
Top Selling Cannabis Brands
Data for this report comes from real-time sales reporting by participating cannabis retailers via their point-of-sale systems, which are linked up with Headset’s business intelligence software. Headset’s data is very reliable, as it comes digitally direct from our partner retailers. However, the potential does exist for misreporting in the instance of duplicates, incorrectly classified products, inaccurate entry of products into point-of-sale systems, or even simple human error at the point of purchase. Thus, there is a slight margin of error to consider. Brands listed on this page are ranked in the top twenty within the market and product category by total retail sales volume.

