Jan-2026
Sales
Trend
6-Month
Product Count
SKUs
Avg Price
YoY Sales Change
YoY Price Change
Market Insights Snapshot
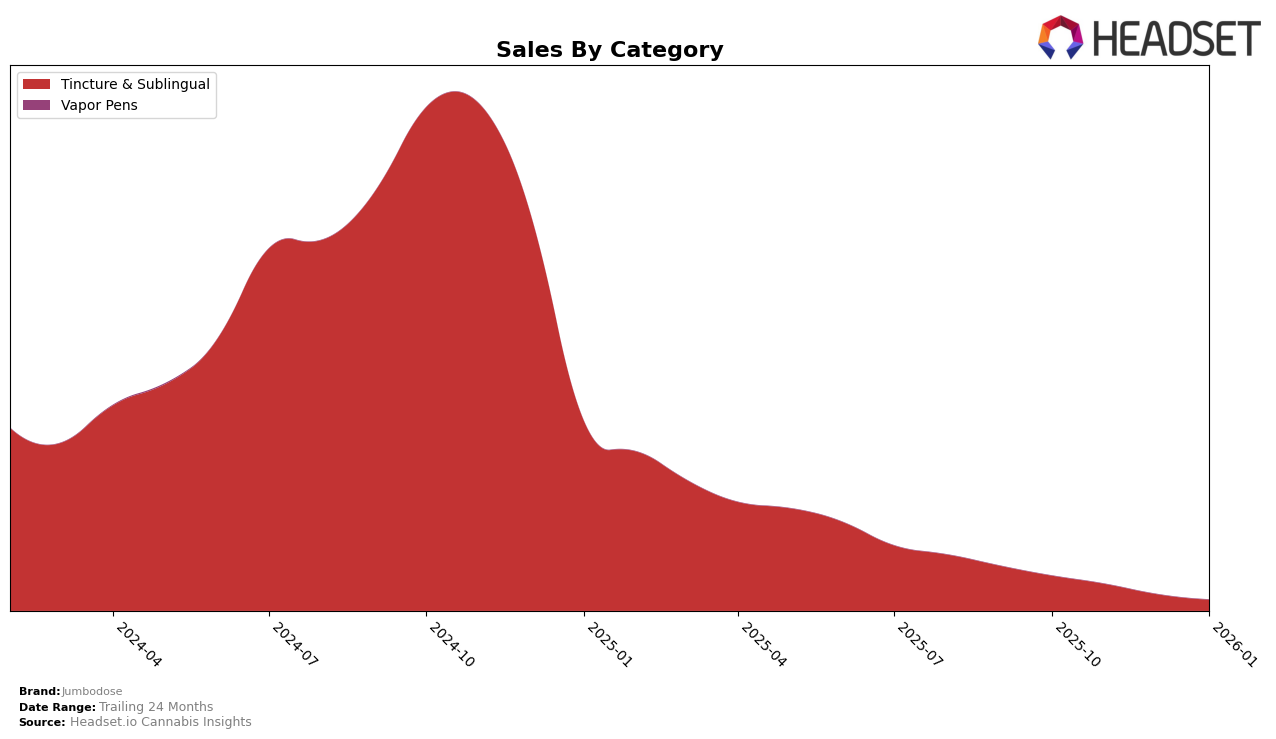
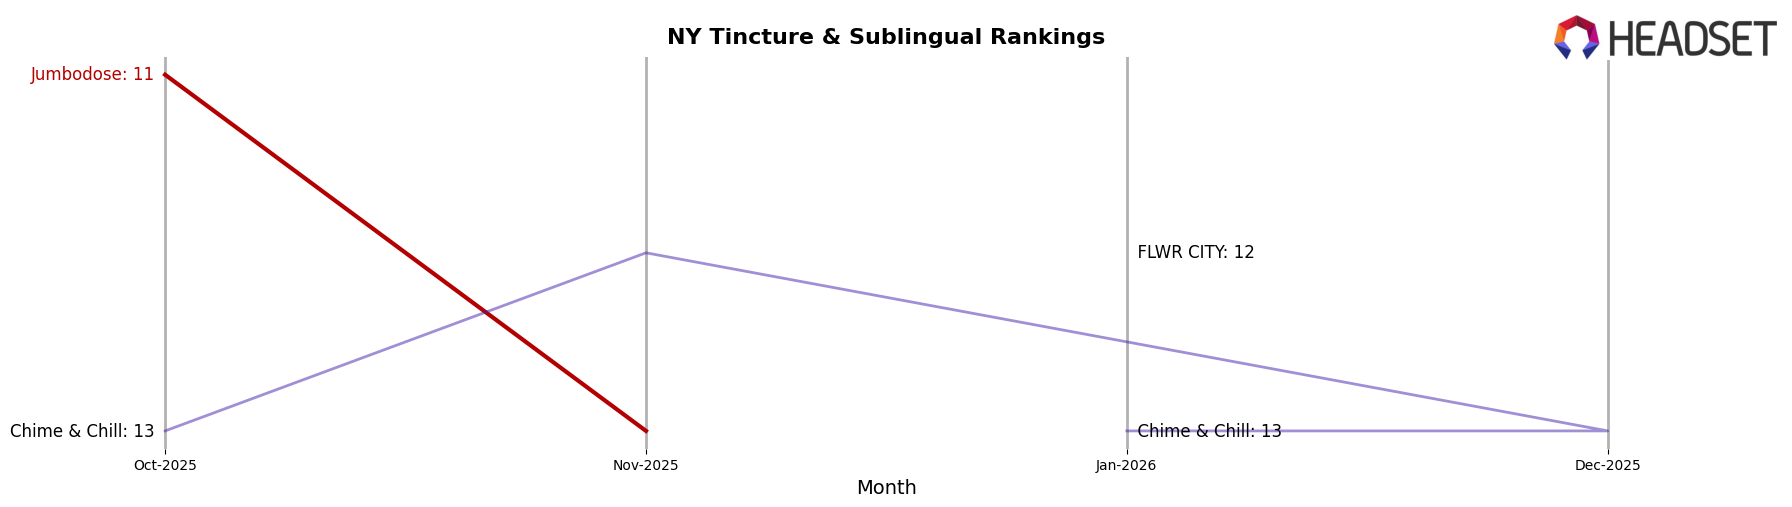
Jumbodose has shown a varied performance across different categories and states in recent months. In the New York market, the brand has maintained a presence in the Tincture & Sublingual category, albeit with some fluctuations in ranking. Specifically, Jumbodose was ranked 11th in October 2025, then slipped to 13th in November 2025, before falling out of the top 30 by December 2025. This downward trajectory suggests challenges in maintaining competitive positioning within this particular category in New York. Despite these challenges, Jumbodose's sales figures in October 2025 were notably strong at $16,590, indicating a solid market presence before the decline in rank.
Interestingly, the absence of Jumbodose from the top 30 rankings in December 2025 and January 2026 in New York's Tincture & Sublingual category could imply either increased competition or a strategic shift by the brand. This absence marks a significant change from earlier months when Jumbodose was a notable contender in the rankings. Such movements could be indicative of broader market trends or internal brand strategies that have yet to be fully understood. Observing these shifts provides valuable insights into the competitive dynamics of the cannabis market, particularly in how brands like Jumbodose navigate category-specific challenges and opportunities.
Competitive Landscape
In the competitive landscape of Tincture & Sublingual products in New York, Jumbodose has experienced notable fluctuations in its market position. Starting from October 2025, Jumbodose held the 11th rank but saw a decline to 13th by November 2025, with subsequent months missing from the top 20, indicating a significant drop in visibility. This decline in rank corresponds with a decrease in sales, from a high in October to a lower figure in November. Meanwhile, competitors like FLWR CITY entered the top 20 in January 2026, securing the 12th position, suggesting a rise in their market presence. Similarly, Chime & Chill maintained a stable position around the 12th and 13th ranks, showing consistent performance, while Canna Dots emerged in December 2025 at the 12th rank, indicating a potential threat to Jumbodose's market share. These shifts highlight the competitive pressures Jumbodose faces and the need for strategic adjustments to regain its standing in the New York market.
Notable Products
In January 2026, the CBN/THC 5:1 Doze Tincture maintained its position as the top-selling product for Jumbodose, despite a slight decrease in sales to 41 units. The CBD/THC 5:1 Chill Tincture showed a notable improvement, climbing to the second position after being ranked fourth in December 2025. The CBG/THC 5:1 Focus Tincture shared the second spot, maintaining its strong performance from the previous month. The Hybrid Mega Tincture rose to third place from fifth, although its sales volume was relatively low at 9 units. The Rosin Drops Hash Tincture, previously a top contender, fell to fourth place as its sales sharply declined.
Top Selling Cannabis Brands
Data for this report comes from real-time sales reporting by participating cannabis retailers via their point-of-sale systems, which are linked up with Headset’s business intelligence software. Headset’s data is very reliable, as it comes digitally direct from our partner retailers. However, the potential does exist for misreporting in the instance of duplicates, incorrectly classified products, inaccurate entry of products into point-of-sale systems, or even simple human error at the point of purchase. Thus, there is a slight margin of error to consider. Brands listed on this page are ranked in the top twenty within the market and product category by total retail sales volume.

