Jun-2026
Sales
Trend
6-Month
Product Count
SKUs
Avg Price
YoY Sales Change
YoY Price Change
Market Insights Snapshot
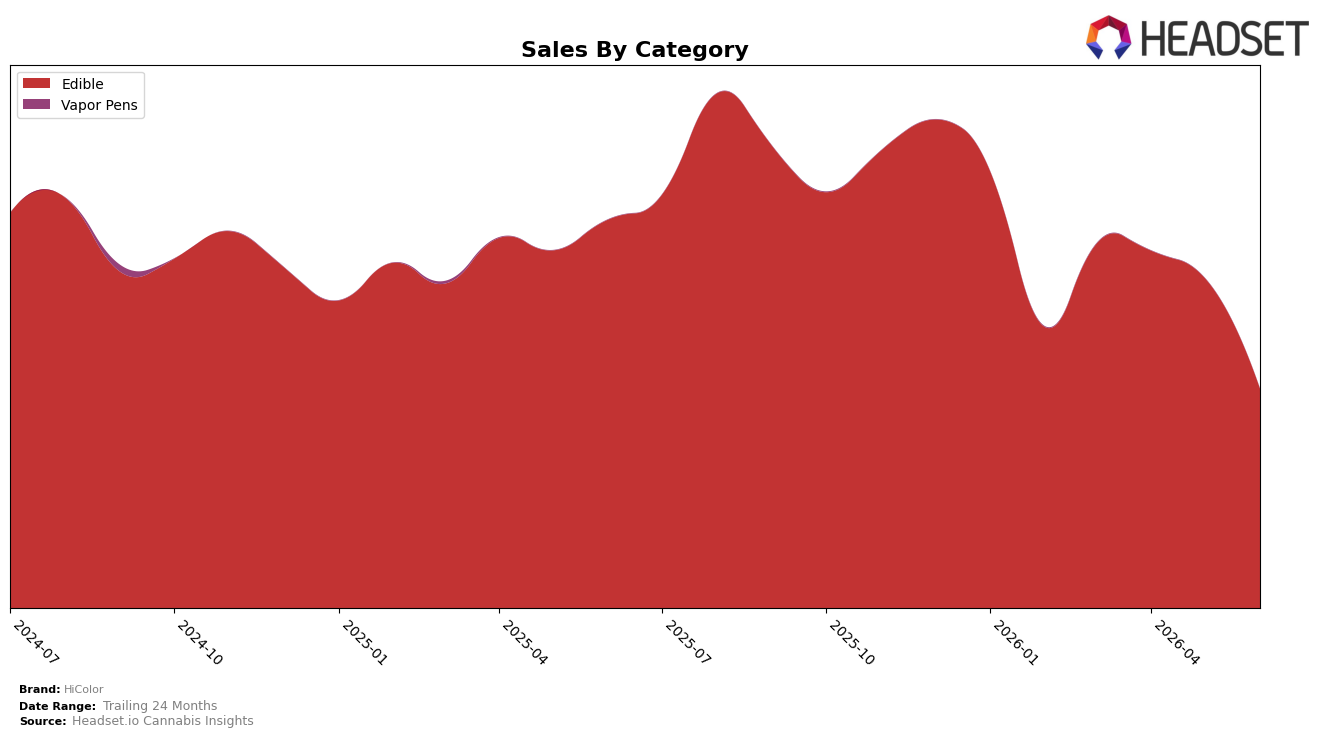
HiColor concentrated entirely in Edible during June 2026, with category share at 100.0% and an average price down 4.23% year over year while sales declined 43.56% year over year. Month over month, Edible sales fell 33.59% alongside a full-category mix at 100.0%, and HiColor held rank 16 in Edible in Maryland. The pattern implies reliance on a single-category footprint that amplifies volatility: a 43.56% year-over-year contraction and 33.59% month-over-month pullback within Edible leave little buffer for demand shocks or pricing shifts.
With a 100.0% Edible mix and a rank position of 16 in Maryland, HiColor trades diversification upside for focused exposure, meaning pricing levers and flavor/format differentiation must carry the load when category headwinds produce a 43.56% year-over-year decline. The 4.23% price decrease combined with a 33.59% month-over-month sales drop indicates elasticity is not offsetting volume losses at current price points, implying the positioning should pivot toward margin-aware pack architecture or selective channel expansion to stabilize rank around 16 while reducing sensitivity to single-category swings.
Competitive Landscape
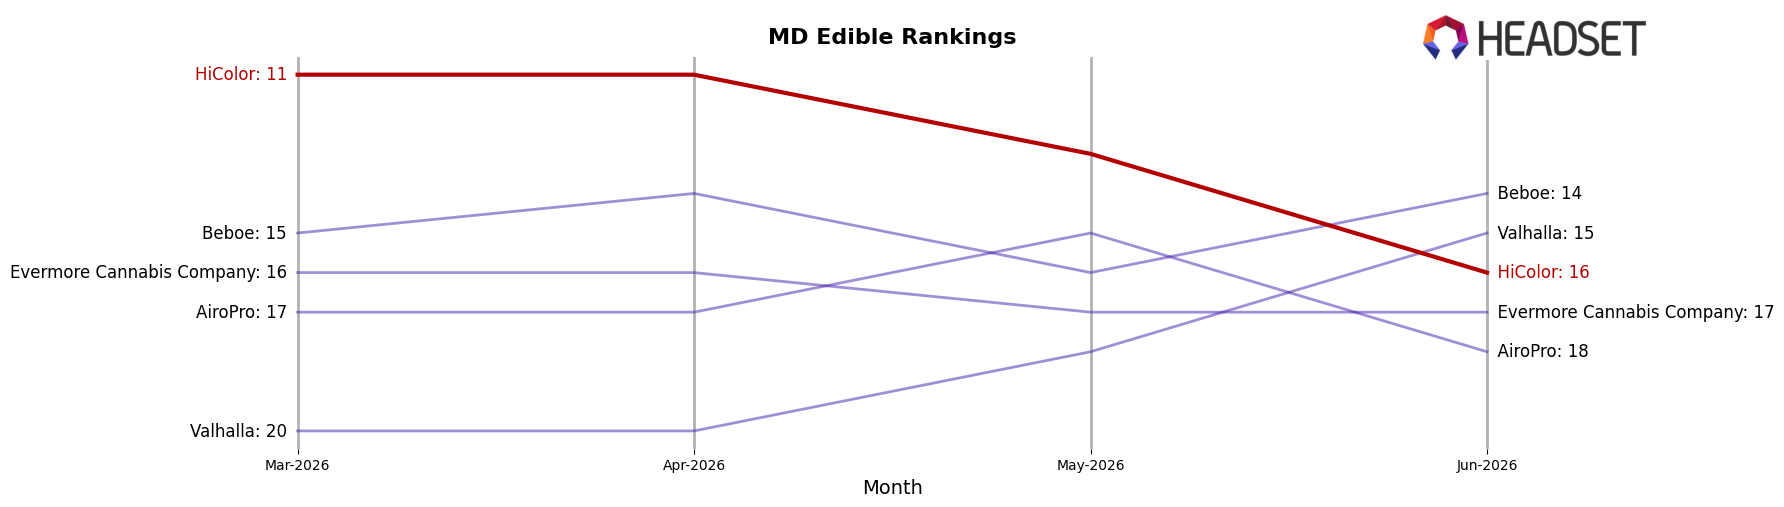
HiColor is ranked #16 in MD Edible in June 2026, down 6 positions year over year from #10, and 5 spots lower than March 2026 when it sat at #11; the brand’s peak of #7 in August 2025 contrasts with a 9-rank slide since that high point, implying share has migrated to faster risers. Competitors are moving in opposite directions: Incredibles climbed to #1 from #3 with 49.4% year-over-year sales growth, while Betty's Eddies slipped from #1 to #2 with a 10.8% decline; meanwhile, Jams advanced from #9 to #5 on 57.0% growth, outpacing HiColor’s downward momentum. The pattern implies HiColor’s rank trajectory is being pressured by competitors with accelerating gains, suggesting the brand must counter share loss concentrated among the top 5 rather than broad market softness.
Notable Products
CBN/THC 1:1 Blackberry Dream Gummies 10-Pack (100mg CBN, 100mg THC) posted the steepest decline in June 2026 at -60.0% MoM while dropping to rank 3, outpacing the -41.4% slide for Blueberry RSO Gummy Gummies 10-Pack (100mg) at rank 2. Pineberry RSO Gummy Cubes 10-Pack (100mg) held rank 1 with a -2.4% MoM dip, and four of the top ten are Edible SKUs from the RSO gummy family concentrated in ranks 1 through 6. The concentration at the top alongside double-digit declines of -48.6% and -47.3% for Cherry RSO Gummies 10-Pack (100mg) and Sour Lemon Drop RSO Gummies 10-Pack (100mg) implies a lineup leaning heavily on legacy RSO flavors that are absorbing broad demand softening. This mix suggests HiColor’s commercial direction may require refreshing the RSO-centric portfolio to stabilize share while protecting the roughly $23,249 flagship scale at rank 1.
Top Selling Cannabis Brands
Data for this report comes from real-time sales reporting by participating cannabis retailers via their point-of-sale systems, which are linked up with Headset’s business intelligence software. Headset’s data is very reliable, as it comes digitally direct from our partner retailers. However, the potential does exist for misreporting in the instance of duplicates, incorrectly classified products, inaccurate entry of products into point-of-sale systems, or even simple human error at the point of purchase. Thus, there is a slight margin of error to consider. Brands listed on this page are ranked in the top twenty within the market and product category by total retail sales volume.

