Jun-2026
Sales
Trend
6-Month
Product Count
SKUs
Avg Price
YoY Sales Change
YoY Price Change
Market Insights Snapshot
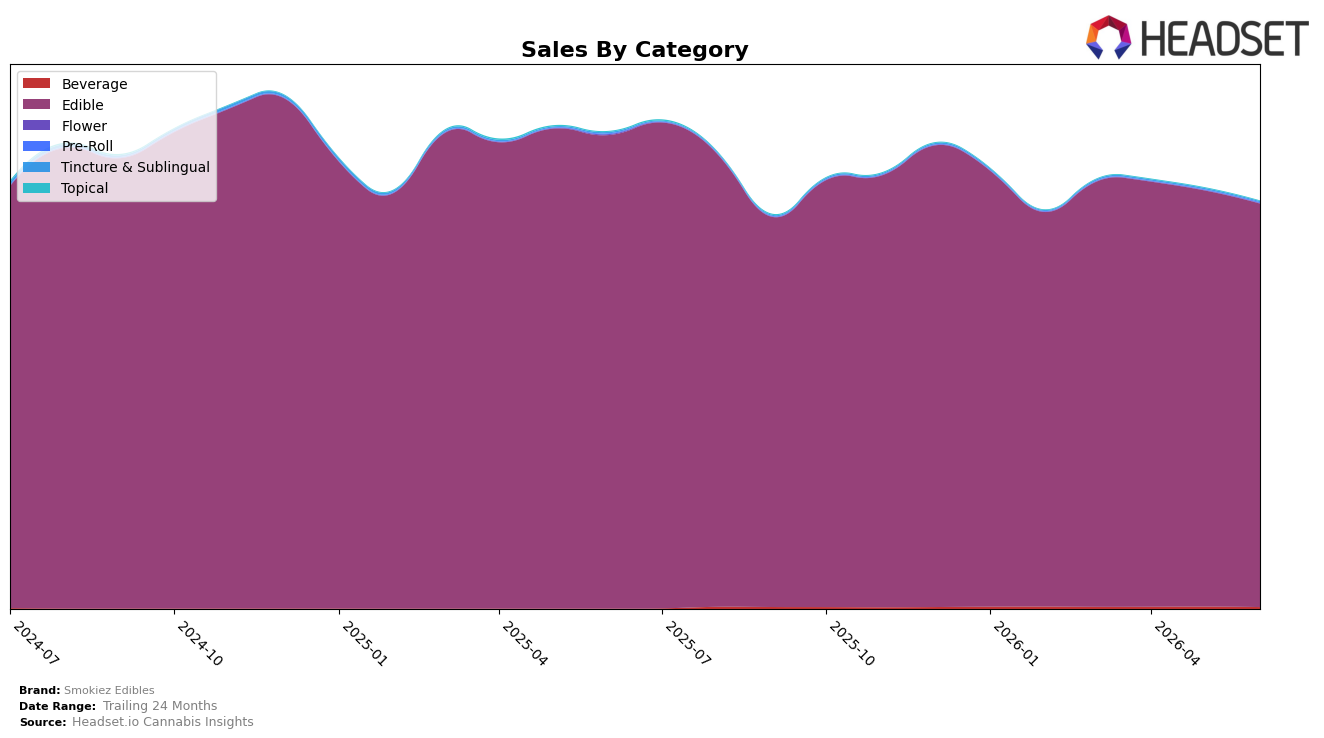
In June 2026, Smokiez Edibles remained overwhelmingly concentrated in Edible at 99.33% share, while Beverage held 0.37% and Tincture & Sublingual 0.15%, indicating a narrow mix despite a Pre-Roll uptick to 0.07% share. Year over year, Edible sales fell 14.80% and Tincture & Sublingual declined 32.82%, while Topical contracted 47.79%; month over month, Edible slipped 3.04% and Beverage dropped 23.66% as Tincture & Sublingual retreated 27.45%. Countering these declines, Pre-Roll grew 9.38% year over year and surged 224.57% month over month, albeit from a small base, and average price moved down 4.38% year over year to $14.69. The mix implies heavy dependence on a contracting Edible core with nascent diversification, as the Pre-Roll spike provides a testable entry point rather than a material share shift today.
Positioning-wise, holding rank 5 in Edible in Missouri while the core category fell 14.80% year over year and 3.04% month over month suggests the brand is competing on depth within Edible rather than breadth across form factors. The 0.37% Beverage share with a 23.66% month-over-month decline and the 0.15% Tincture & Sublingual share with a 27.45% month-over-month decline indicate limited traction in ancillary categories at current price points of $24.77 and $34.21, respectively, while the $14.69 average price overall and 4.38% year-over-year price decrease point to a value-leaning stance in Edible. The pattern implies Smokiez Edibles can defend its Edible position through price-pack architecture and assortment while selectively nurturing the small but fast-moving Pre-Roll beachhead to diversify risk without diluting the Edible rank anchor.
Competitive Landscape
Smokiez Edibles sits at rank #5 in Missouri Edible for June 2026, a 2-place improvement versus June 2025, but down 1 position from March 2026 when it was #4; the brand’s historical ceiling was rank #2 in July 2025, indicating a 3-rank gap from its peak. In the same June 2026 snapshot, Gron / Grön holds #1 while posting a -13.1% year-over-year sales change, and Good Taste has advanced to #4 with an 8-rank year-over-year climb and a 65.3% sales increase, suggesting Smokiez Edibles is losing relative momentum to faster risers despite its year-over-year rank gain. The directional picture implies Smokiez Edibles’ trajectory is stabilizing below the top tier, with recent quarter-on-quarter slippage outweighing the year-over-year improvement and signaling the need to counter competitors that are converting share gains into higher ranks.

Notable Products
Sour Watermelon Live Resin Fruit Chews 10-Pack (100mg) delivered the standout move in June 2026 with a +240.8% month-over-month surge to rank #2, while Sativa Sour Peach Fruit Chews 10-Pack (100mg) climbed +127.9% to hold #1; together these gains contrast with a -12.0% decline for Sativa Sweet Peach Fruit Chews 20-Pack (100mg) at rank #9. The middle tier softened, with Indica Sweet Blue Raspberry Fruit Chews 10-Pack (100mg) down -3.3% at #5 and Sour Blackberry Fruit Chews 10-Pack (100mg) down -3.9% at #10, even as Hybrid Sweet Watermelon Fruit Chews 10-Pack (100mg) rose +175.7% to #3. Eight of the top ten are Fruit Chews 10-Pack formats, and the 20-Pack setback alongside 10-Pack triple-digit gains implies Smokiez Edibles is consolidating demand into core 10-Pack SKUs and prioritizing velocity over larger-pack experiments.
Top Selling Cannabis Brands
Data for this report comes from real-time sales reporting by participating cannabis retailers via their point-of-sale systems, which are linked up with Headset’s business intelligence software. Headset’s data is very reliable, as it comes digitally direct from our partner retailers. However, the potential does exist for misreporting in the instance of duplicates, incorrectly classified products, inaccurate entry of products into point-of-sale systems, or even simple human error at the point of purchase. Thus, there is a slight margin of error to consider. Brands listed on this page are ranked in the top twenty within the market and product category by total retail sales volume.

