.svg)

Sep-2026
Sales
Trend
6-Month
Product Count
SKUs
Avg Price
YoY Sales Change
YoY Price Change


Where to Buy
Medicine Farm is stocked at 105 licensed dispensaries across Oregon, with the deepest coverage in Portland, Eugene, Bend, McMinnville, and Salem. Search by ZIP code or city below to find the closest one, or filter by product type if you are after a specific format.
Market Insights Snapshot
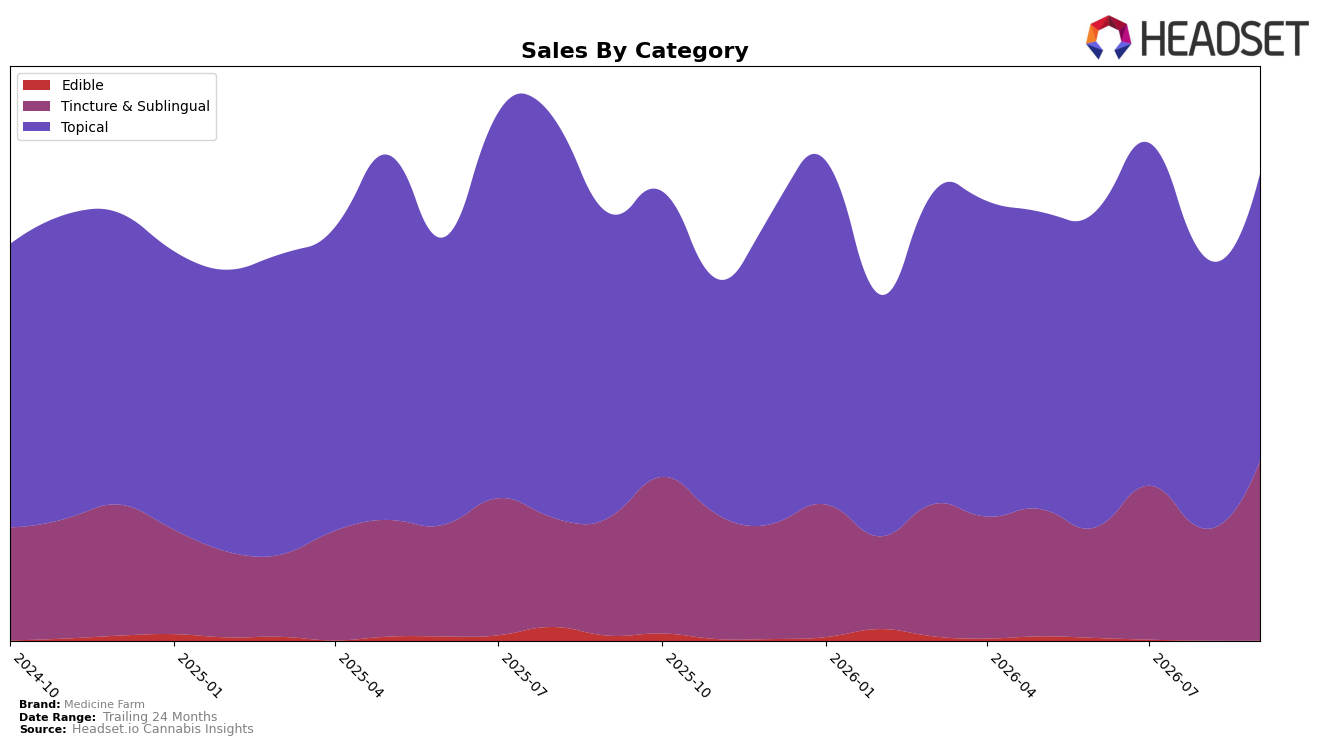
In September 2026, Medicine Farm concentrated 61.54% of sales in Topical, down year over year by 5.89% but up month over month by 5.62%, while Tincture & Sublingual expanded to 38.46% share with a 52.72% YoY increase and a 60.62% MoM surge. The average price fell 12.24% YoY to $33.78 even as brand sales grew 9.11% YoY, indicating volume gains offsetting price compression; across 24 months, sales are still down 22.03%, suggesting mix and pricing shifts are recent rather than structural. The pattern implies a pivot toward faster-turn Tincture & Sublingual while maintaining a majority in Topical, with price elasticity enabling unit growth despite lower realized pricing.
With Topical holding rank 2 in Oregon and growing 5.62% MoM against a 52.72% YoY surge in Tincture & Sublingual, the brand’s positioning skews toward defending a high Topical rank while capturing incremental share from the adjacent format. The 38.46% mix in Tincture & Sublingual alongside a 12.24% YoY price decline and a 60.62% MoM category lift suggests a deliberate trade-off: preserve Topical leadership with stable MoM gains while using lower price points to accelerate penetration in Tincture & Sublingual, implying near-term growth will rely more on cross-format customer migration than on price recovery.
Competitive Landscape
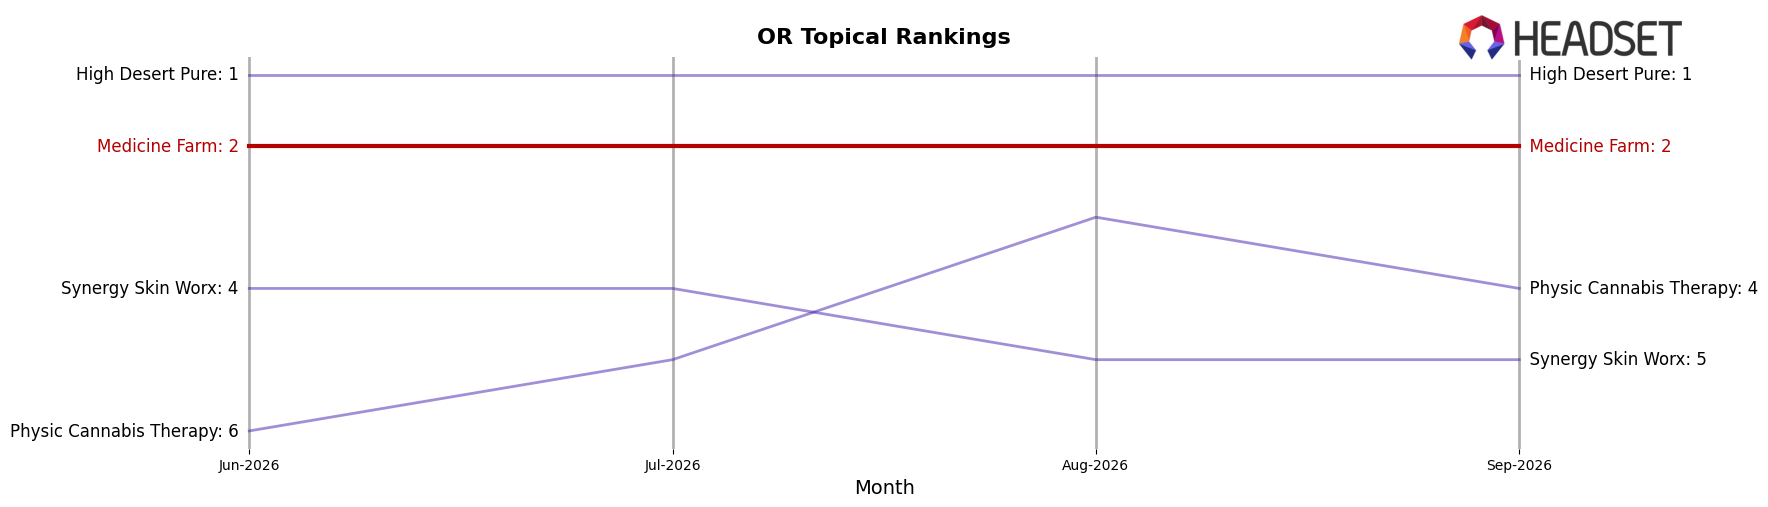
Medicine Farm sits at rank #2 in OR Topical in September 2026, unchanged from #2 year over year, with a steady #2 position maintained over the last three months and a peak rank of #2 also in September 2026; meanwhile, category leader High Desert Pure holds #1 but with a -2.26% sales YoY change, and challenger Buddies moved from #4 to #3 on 58.68% YoY sales growth while Physic Cannabis Therapy advanced from #7 to #4 on 163.63% YoY growth; this pattern implies Medicine Farm’s flat rank at #2 is increasingly vulnerable as faster-rising competitors compress the gap above and below.
Notable Products
CBD/ THC/CBC 2:3:1 Mood Elixir Happy Tonic Tincture (315mg CBD, 475mg THC, 150mg CBC, 15ml, 0.5oz) posted the largest movement in September 2026 with a 98.8% month-over-month gain, while Extra Strength Dragons Blend Balm (65mg THC, 0.25oz) slid 45.5% and the CBD/THC 1:1 Mini Phoenix Blend Salve (125mg CBD, 125mg THC, 0.25oz) climbed 22.6% to rank 1. Tincture & Sublingual products accounted for three of the top five ranks (positions 3, 4, and 5), with the CBD/THC/CBN 2:3:1 Lunar Elixir Tincture up 26.0% at rank 3 and the Sativa Crimson Berry Tincture up 24.8% at rank 5. Despite Phoenix Blend Balm holding rank 2 on 13.1% growth and the CBD/THC 1:1 Phoenix Blend Salve at rank 6 on 12.9% growth, Topical positions were mixed due to the 45.5% decline at rank 7. The pattern implies a pivot toward cannabinoid-rich Tincture & Sublingual experimentation driving mix shift, while legacy Topicals maintain placement but face volatility.
Top Selling Cannabis Brands






Data for this report comes from real-time sales reporting by participating cannabis retailers via their point-of-sale systems, which are linked up with Headset’s business intelligence software. Headset’s data is very reliable, as it comes digitally direct from our partner retailers. However, the potential does exist for misreporting in the instance of duplicates, incorrectly classified products, inaccurate entry of products into point-of-sale systems, or even simple human error at the point of purchase. Thus, there is a slight margin of error to consider. Brands listed on this page are ranked in the top twenty within the market and product category by total retail sales volume.

