.svg)

Sep-2026
Sales
Trend
6-Month
Product Count
SKUs
Avg Price
YoY Sales Change
YoY Price Change


Market Insights Snapshot
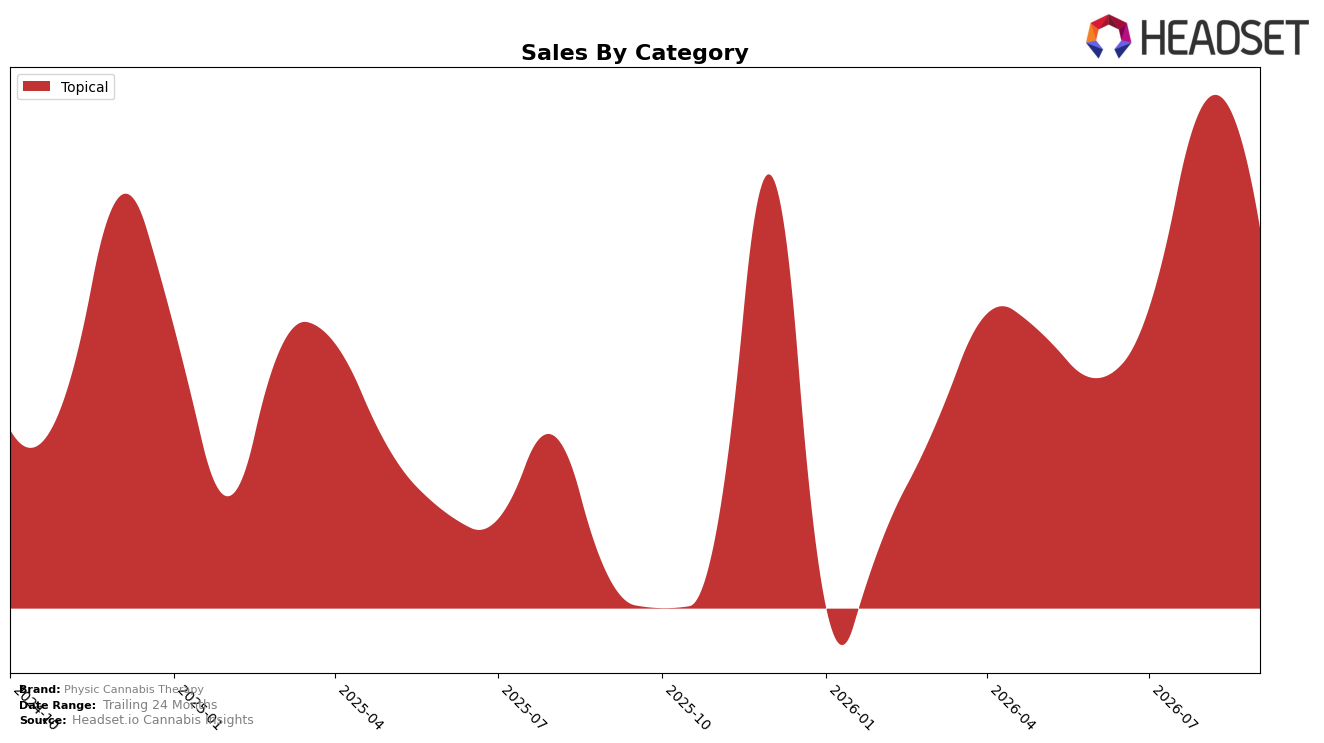
Physic Cannabis Therapy operated as a single-category brand in September 2026, with Topical accounting for 100.0% of sales and a year-over-year change of 163.6% alongside a month-over-month decline of 18.3%. Within Topical, the average price fell 6.3% YoY to $41.68 while the brand held rank 4 in Oregon Topicals, indicating volume expanded faster than price contraction even as monthly sell-through softened. The pattern implies a concentrated bet on Topicals that is yielding rapid annual scale but exposing the brand to near-term volatility from a single-category dependency.
The combination of a 163.6% YoY surge against an 18.3% MoM dip and a 6.3% YoY price decrease suggests Physic Cannabis Therapy is trading price for share within Topicals while absorbing seasonal or promotional pullbacks. Holding the number 4 rank in Oregon Topicals with 100.0% category mix points to defensible placement but limited diversification, implying the brand’s positioning is as a price-competitive, volume-oriented Topicals specialist that will need either mix expansion or further efficiency to stabilize month-to-month swings.
Competitive Landscape
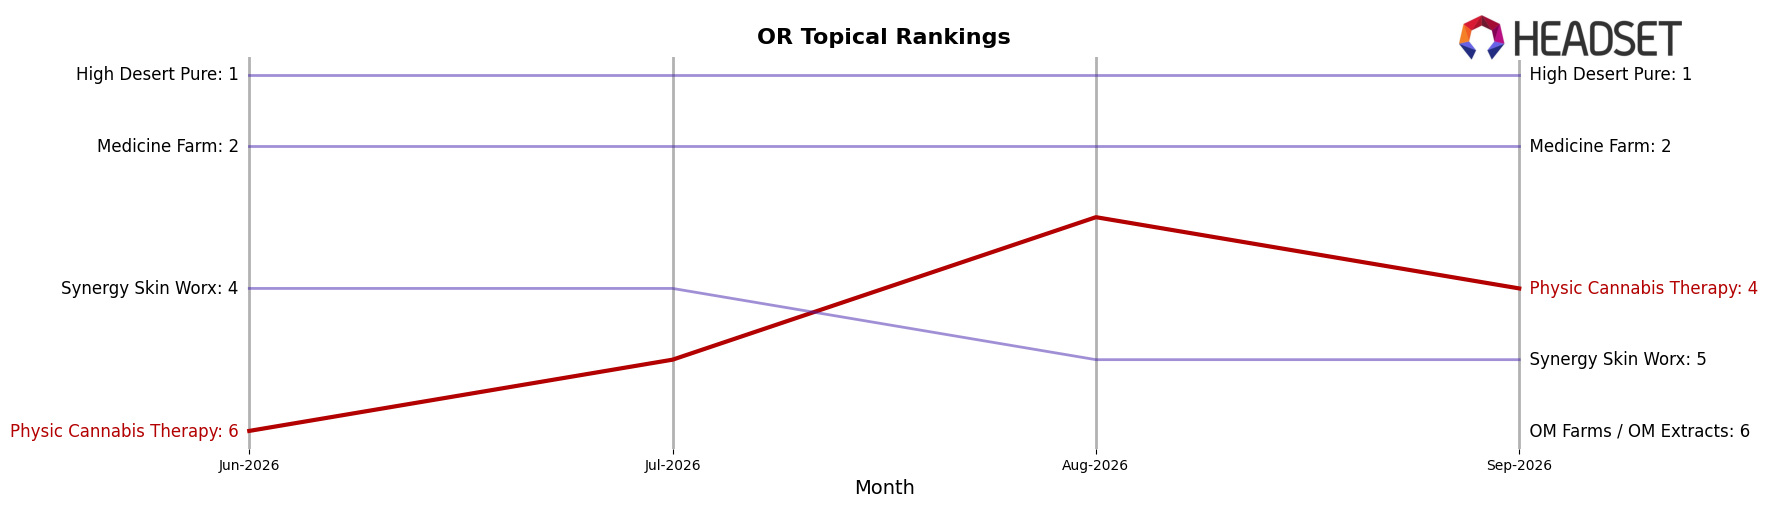
Physic Cannabis Therapy is ranked #4 in OR Topical in September 2026, improving 3 positions YoY from #7 and climbing 2 spots since June 2026 from #6, while also peaking at #3 in August 2026; meanwhile, High Desert Pure held at #1 YoY despite a -2.26% sales change and Buddies advanced from #4 to #3 on 58.68% YoY growth, with Medicine Farm static at #2 alongside a -5.89% YoY decline. This mix of upward rank mobility alongside competitors experiencing both negative (-5.89%, -2.26%) and positive (+58.68%) sales swings implies Physic Cannabis Therapy’s trajectory toward its August 2026 peak of #3 is tied less to category expansion and more to share reallocation against a softening #2 and a surging #3, signaling a narrow path to sustained top-3 positioning.
Notable Products
Field Balm (128mg CBD 460mg THC, 1.8 oz) led the downturn with a -39.99% month-over-month slide while holding rank 1, as Wood Balm (500mg THC, 1.8 oz) climbed +35.78% to rank 2 in September 2026. With the top three all in Topical and occupying ranks 1–3, the portfolio is concentrated in a single category, which implies reliance on balm-format demand rather than a diversified mix. The CBD:THC 1:3 Wood Balms Away (150mg CBD, 450mg THC, 0.18oz) entered at rank 3 with minimal sales presence relative to the leaders, and the single largest SKU’s decline contrasted with the runner-up’s gain suggests intra-line substitution rather than category contraction. Taken together, these shifts imply Physic Cannabis Therapy is pivoting within Topicals toward higher-THC balms, trading share between flagship and secondary SKUs to maintain category leadership.
Top Selling Cannabis Brands






Data for this report comes from real-time sales reporting by participating cannabis retailers via their point-of-sale systems, which are linked up with Headset’s business intelligence software. Headset’s data is very reliable, as it comes digitally direct from our partner retailers. However, the potential does exist for misreporting in the instance of duplicates, incorrectly classified products, inaccurate entry of products into point-of-sale systems, or even simple human error at the point of purchase. Thus, there is a slight margin of error to consider. Brands listed on this page are ranked in the top twenty within the market and product category by total retail sales volume.

