Jun-2026
Sales
Trend
6-Month
Product Count
SKUs
Avg Price
YoY Sales Change
YoY Price Change
Market Insights Snapshot
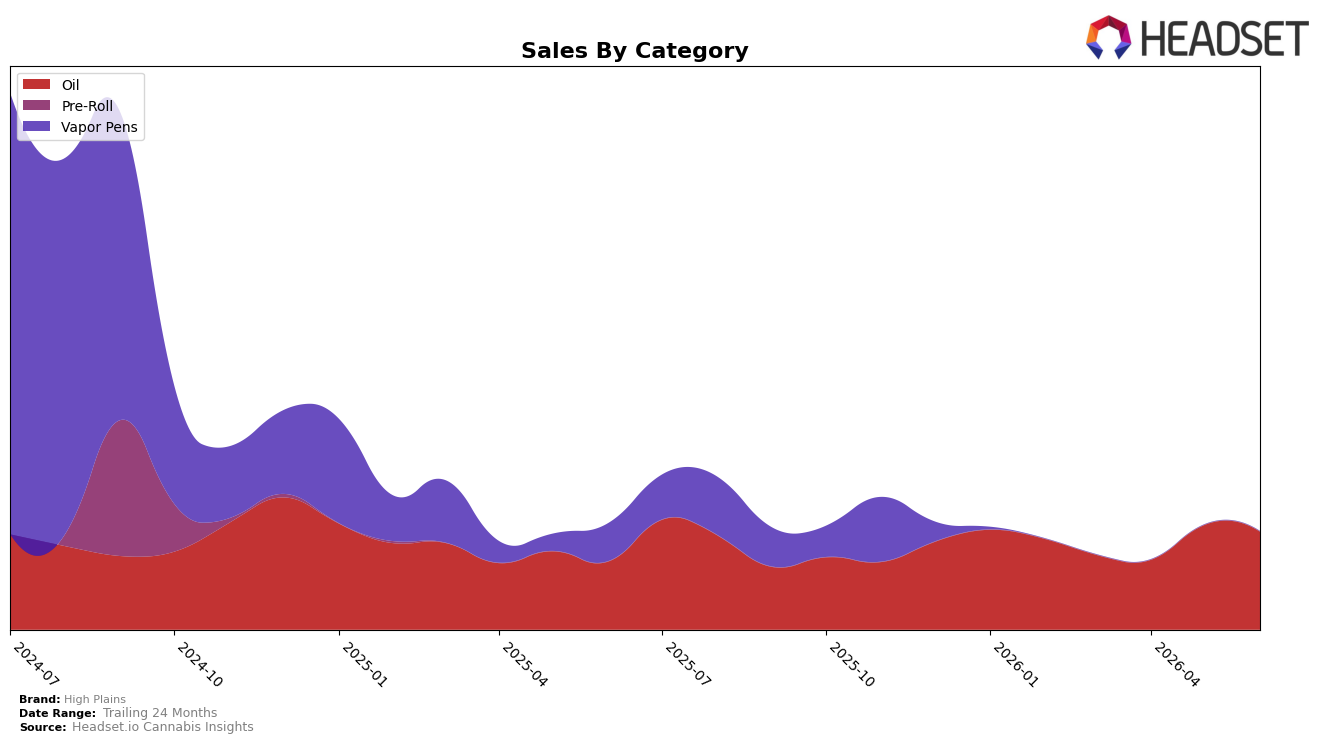
In June 2026, High Plains concentrated entirely in Oil, with the category at 100.0% mix and average price at $32.44, while Oil sales grew 43.95% year over year but fell 6.51% month over month. Despite the single-category focus, overall brand sales were down 7.43% year over year and average price declined 6.84% year over year, placing Oil as both the growth engine and the short-term drag. The pattern implies reliance on one category amplifies volatility: a 43.95% YoY surge can be offset by a 6.51% MoM dip when there is no balancing category, so month-to-month shocks transmit directly to total performance.
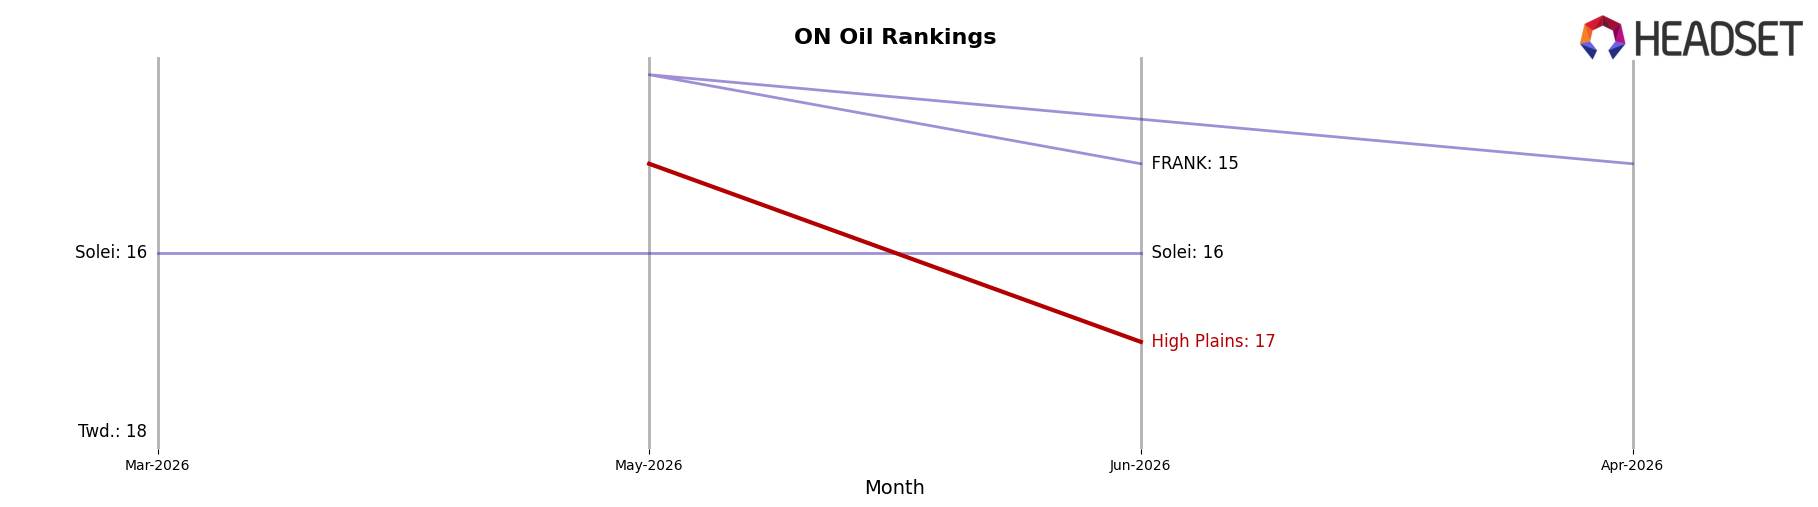
Within Ontario Oil, High Plains sits at rank 17, a position consistent with a brand leaning on depth over breadth while average prices compress 6.84% YoY and the category’s MoM softness registers at 6.51%. With Oil at 100.0% share and brand sales down 7.43% YoY against a 43.95% YoY lift in the sole category, the gap signals mix and pricing, not category demand, as the constraint. The implication is that defending or improving rank 17 will hinge more on price-pack architecture and sustaining unit velocity within Oil than on expanding mix, because a single-category footprint converts small MoM declines into outsized rank risk.
Competitive Landscape
High Plains sits at #17 in ON Oil in June 2026, improving 4 spots from #21 year over year, after peaking at #15 in May 2026 and rising 4 ranks versus March 2026; in contrast, Mod climbed from #2 to #1 while Redecan fell from #1 to #2 with a -29.2% YoY sales change, indicating High Plains is inching upward against a reshuffling top tier where ufeelu advanced from #6 to #5 with +39.4% YoY growth. The pattern implies High Plains’ gradual rank gains are tied to volatility above it, so sustaining movement from #17 toward the mid-teens will likely require capturing share during competitor churn rather than relying on marginal quarterly lifts.
Notable Products
Indica THC Oil Drops (35ml) led June 2026 with rank 1 but slipped by 6.5% month over month, while no other SKU offset this decline in the top tier, implying concentration risk. With Oil as the sole represented category in the top 10 cohort for June 2026 and a single-SKU leadership at rank 1 alongside a negative MoM change of 6.5%, the mix skews toward dependency rather than breadth. The $10,994 in sales paired with rank 1 and a 6.5% drop suggests velocity at the top without depth beneath it. This pattern implies High Plains is commercially concentrated in Oil, prioritizing a flagship SKU over portfolio diversification.
Top Selling Cannabis Brands
Data for this report comes from real-time sales reporting by participating cannabis retailers via their point-of-sale systems, which are linked up with Headset’s business intelligence software. Headset’s data is very reliable, as it comes digitally direct from our partner retailers. However, the potential does exist for misreporting in the instance of duplicates, incorrectly classified products, inaccurate entry of products into point-of-sale systems, or even simple human error at the point of purchase. Thus, there is a slight margin of error to consider. Brands listed on this page are ranked in the top twenty within the market and product category by total retail sales volume.

