.svg)

Sep-2026
Sales
Trend
6-Month
Product Count
SKUs
Avg Price
YoY Sales Change
YoY Price Change


Where to Buy
Incredibles is stocked at 1,092 licensed dispensaries across Colorado, Illinois, and 11 other states, 252 of them in Colorado, with the deepest coverage in Denver, Colorado Springs, Aurora, Boulder, and Longmont. Search by ZIP code or city below to find the closest one, or filter by product type if you are after a specific format.
Market Insights Snapshot
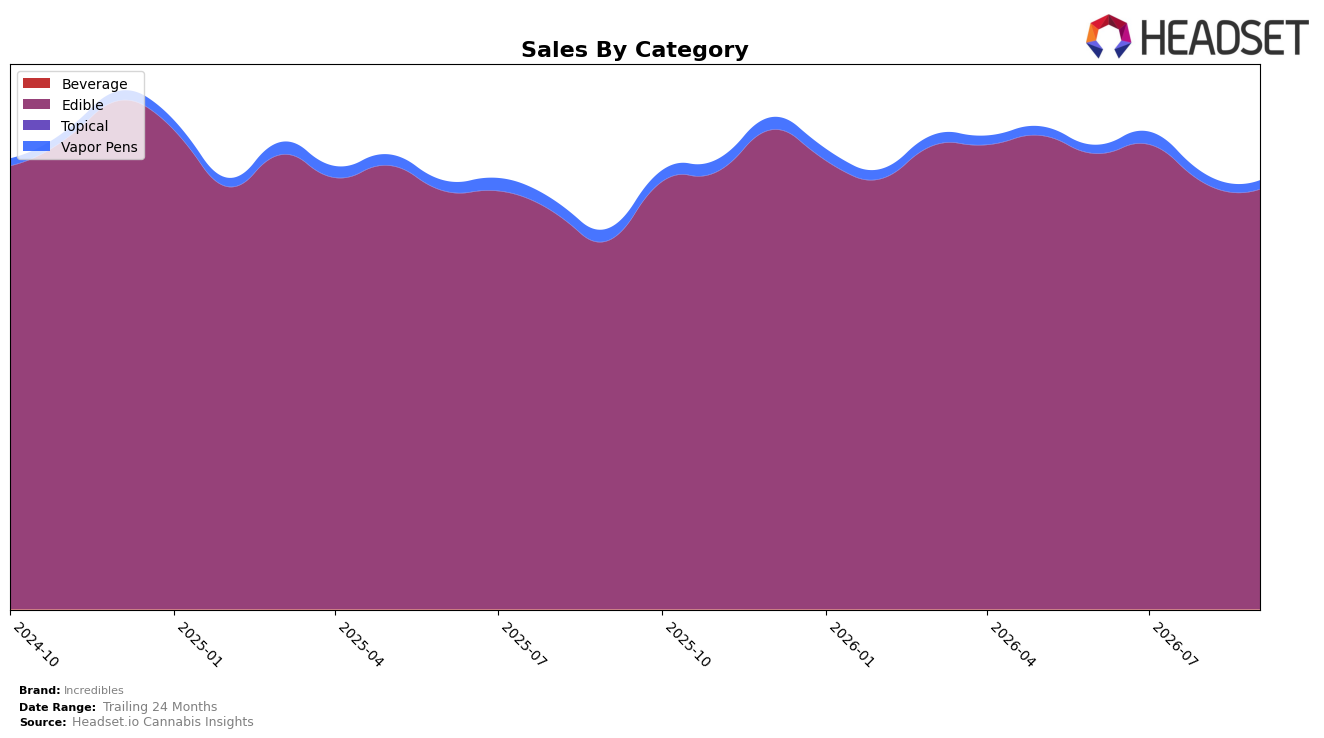
In September 2026, Incredibles concentrated 98.05% of sales in Edible with a 13.96% year-over-year gain, while month-over-month volume in that category dipped 1.39%; Vapor Pens held 1.95% share with a 27.90% YoY decline and a 7.07% MoM drop. Average price fell 3.08% YoY to $14.77, while Edible pricing sat at $14.64 and Vapor Pens at $26.16, implying mix weight toward lower-priced Edible even as overall brand sales grew 12.68% YoY; together with Edible rank 1 in Illinois, the pattern points to a category strategy anchored in Edible dominance despite near-term MoM softness.
The widening gap between a growing Edible base (+13.96% YoY, -1.39% MoM) and a shrinking Vapor Pens line (-27.90% YoY, -7.07% MoM) suggests portfolio focus is reinforcing leadership in Edible while limiting diversification risk, as the 1.95% share in Vapor Pens contributes little cushion if Edible MoM softness persists. With overall brand sales up 12.68% YoY alongside a 3.08% YoY price decrease, unit-led momentum appears concentrated in Edible, and the number 1 Edible rank in Illinois implies pricing headroom and promotional leverage depend on defending Edible depth rather than expanding the underperforming Vapor Pens mix.
Competitive Landscape
Incredibles sits at rank #1 in IL Edible in September 2026 after climbing 1 position from #2 year over year, while maintaining #1 over the last 3 months and hitting a peak rank of #1 in September 2026; in contrast, Wana improved from #3 to #2 with +1.48% year-over-year sales change and Wyld slid from #1 to #3 with -7.95% year-over-year sales change, indicating that Incredibles’ upward rank shift is tied more to competitors’ declines and modest gains than to broad category tailwinds, which implies the current leadership is defensible but contingent on sustaining share against upward-migrating rivals.

Notable Products
Summer Peach Gummies 10-Pack (100mg) posted the steepest decline in September 2026 at -14.4% MoM while dropping to rank 7, and THC/CBG 1:1 Sour Blue Razzberry Gummies 10-Pack (100mg THC, 100mg CBG) fell -16.6% MoM at rank 9; in contrast, Sour Cherry Tarts Gummies 10-Pack (100mg) jumped +23.8% MoM to rank 3. The top two sleep-oriented SKUs both contracted, with CBN/CBG/THC 1:1:2 Snoozzzierberry Gummies 10-Pack (50mg CBN, 50mg CBG, 100mg THC) down -1.2% at rank 1 and THC/CBN 5:1 Snoozzzeberry Gummies 10-Pack (100mg THC, 20mg CBN) down -6.5% at rank 2, while Pineapple Express Fast Acting Gummies 10-Pack (100mg) rose +20.9% at rank 8 to narrow the gap; eight of the top ten are Edible gummies, indicating a concentrated format mix. With the category anchored by a $430,214 leader yet mixed momentum across sleep, fruit, and fast-acting segments, the pattern implies Incredibles is leaning into gummies dominance while product-development focus may need to rebalance from sleep SKUs toward fruit-forward and fast-acting lines that are capturing incremental share.
Top Selling Cannabis Brands






Data for this report comes from real-time sales reporting by participating cannabis retailers via their point-of-sale systems, which are linked up with Headset’s business intelligence software. Headset’s data is very reliable, as it comes digitally direct from our partner retailers. However, the potential does exist for misreporting in the instance of duplicates, incorrectly classified products, inaccurate entry of products into point-of-sale systems, or even simple human error at the point of purchase. Thus, there is a slight margin of error to consider. Brands listed on this page are ranked in the top twenty within the market and product category by total retail sales volume.

