.svg)

Sep-2026
Sales
Trend
6-Month
Product Count
SKUs
Avg Price
YoY Sales Change
YoY Price Change





Where to Buy
Wana is stocked at 1,949 licensed dispensaries across Colorado, Michigan, and 17 other states, 278 of them in Colorado, with the deepest coverage in Denver, Colorado Springs, Boulder, Grand Junction, and Aurora. Search by ZIP code or city below to find the closest one.
Market Insights Snapshot
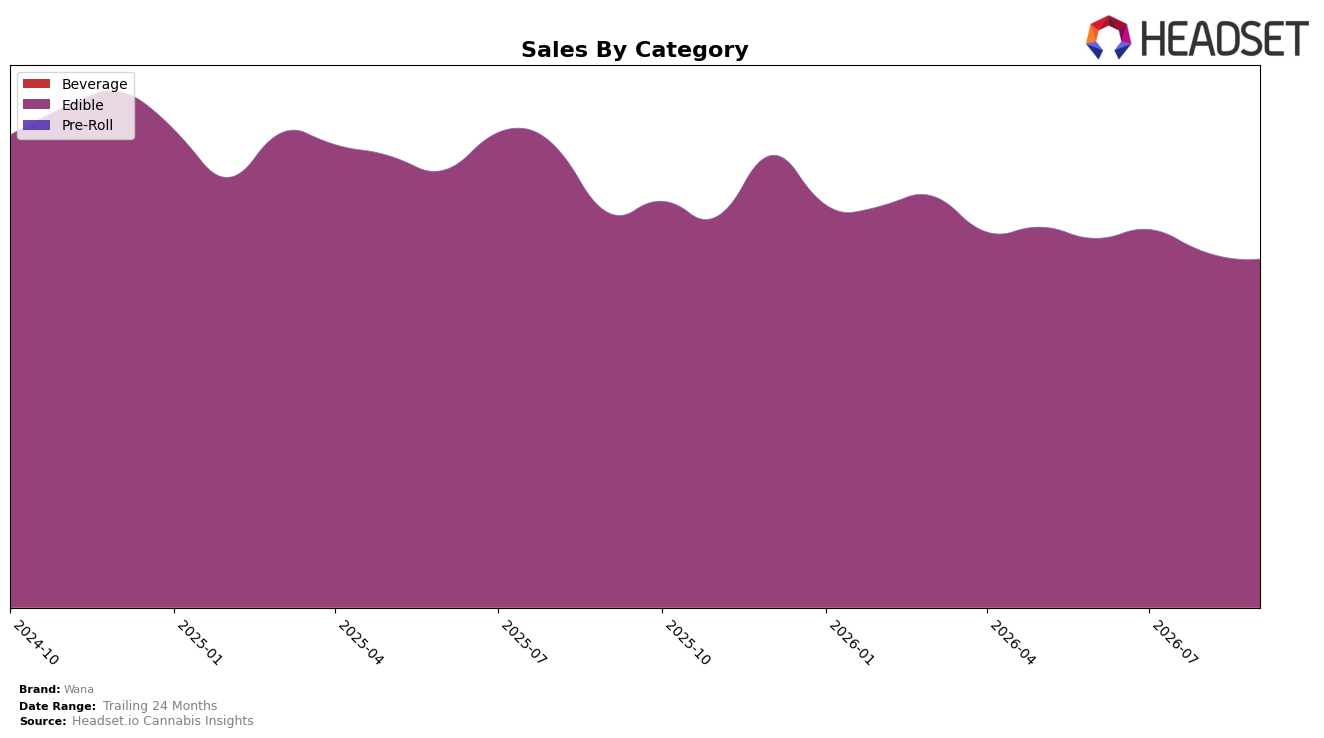
Wana’s category mix in September 2026 was fully concentrated in Edible at 100.0% share, with Edible sales down 11.78% year over year and down 2.03% month over month, while average price slipped 0.54% year over year. Despite the single-category focus, Wana held rank 1 in Edible in Colorado, even as total brand sales declined 11.78% year over year and trended 27.29% below the 24‑month baseline; the pattern implies the brand is leaning on category leadership to offset contracting demand and mild price compression.
The combination of a 100.0% Edible mix and a rank 1 position in Colorado suggests a defensible niche, but the 2.03% month-over-month dip alongside an 11.78% year-over-year slide points to elasticity limits at a $17.77 average price. The implication is that maintaining leadership will require either mix broadening beyond Edible or sharper subsegment targeting within Edible, because a single-category exposure amplifies downside when category demand softens and reduces optionality to recover volume without deeper price moves.
Competitive Landscape
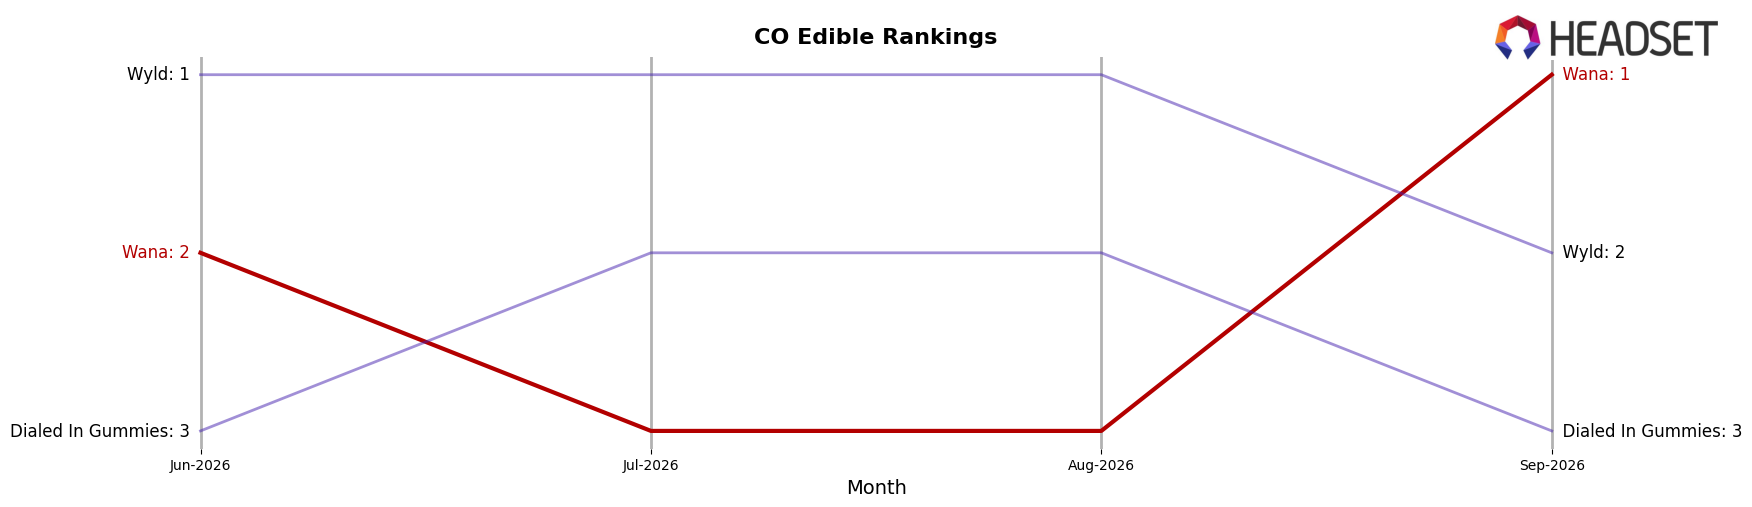
Wana sits at rank 1 in CO Edible in September 2026 after rising 1 position from rank 2 year over year, while its three-month position also improved from rank 2 to rank 1, indicating recent momentum at the top. In contrast, Wyld slipped from rank 1 to rank 2 with a 23.8% year-over-year sales decline, whereas Dialed In Gummies held at rank 3 with 30.6% year-over-year growth, creating pressure from below; this divergence—rising rank for Wana alongside a falling top rival and a faster-growing challenger in third—implies that Wana’s ascent to a peak at rank 1 in September 2026 is defensible near term but will require countering Dialed In Gummies’ growth rate to sustain leadership.
Notable Products
Quick - Hybrid Limoncello Fast Acting Gummies 10-Pack (100mg) posted the steepest decline at -11.99% month over month while sliding to rank 8, and Quick - Sativa Peach Bellini Gummies 20-Pack (100mg) fell -9.93% at rank 3, signaling momentum loss in fast-acting SKUs relative to Wana’s broader lineup. At the top, CBD/THC/CBG/CBN 4:2:1:1 Optimals Stay Asleep Dreamberry Gummies 10-Pack (200mg CBD, 100mg THC, 50mg CBG, 50mg CBN) held rank 1 despite a -1.39% dip, while CBD/CBN/CBG/THC 5:1:1:1 Optimals Fast Asleep Dream Berry Gummies 10-Pack rose +3.31% at rank 2, indicating sleep-focused Optimals are consolidating the lead. Four of the top ten are Classic SKUs, including Classic - Sativa Assorted Sour Gummies 10-Pack (100mg) up +26.19% at rank 5 and Classic - Sour Blueberry Gummies 10-Pack (100mg) down -8.89% at rank 10, pointing to a stable but mixed core that balances premium Optimals volume with a value engine around $828,994 at the category peak. Together these moves imply Wana is leaning into sleep and functional formulations for share defense while pruning or repositioning fast-acting offerings that are ceding rank to Classic and Optimals anchors.
Top Selling Cannabis Brands






Data for this report comes from real-time sales reporting by participating cannabis retailers via their point-of-sale systems, which are linked up with Headset’s business intelligence software. Headset’s data is very reliable, as it comes digitally direct from our partner retailers. However, the potential does exist for misreporting in the instance of duplicates, incorrectly classified products, inaccurate entry of products into point-of-sale systems, or even simple human error at the point of purchase. Thus, there is a slight margin of error to consider. Brands listed on this page are ranked in the top twenty within the market and product category by total retail sales volume.

