.svg)


Where to Buy
J-Bad is stocked at 17 licensed dispensaries across Ohio, with the deepest coverage in Ashtabula, Bowling Green, Cincinnati, Columbus, and Dayton. Search by ZIP code or city below to find the closest one.
Market Insights Snapshot
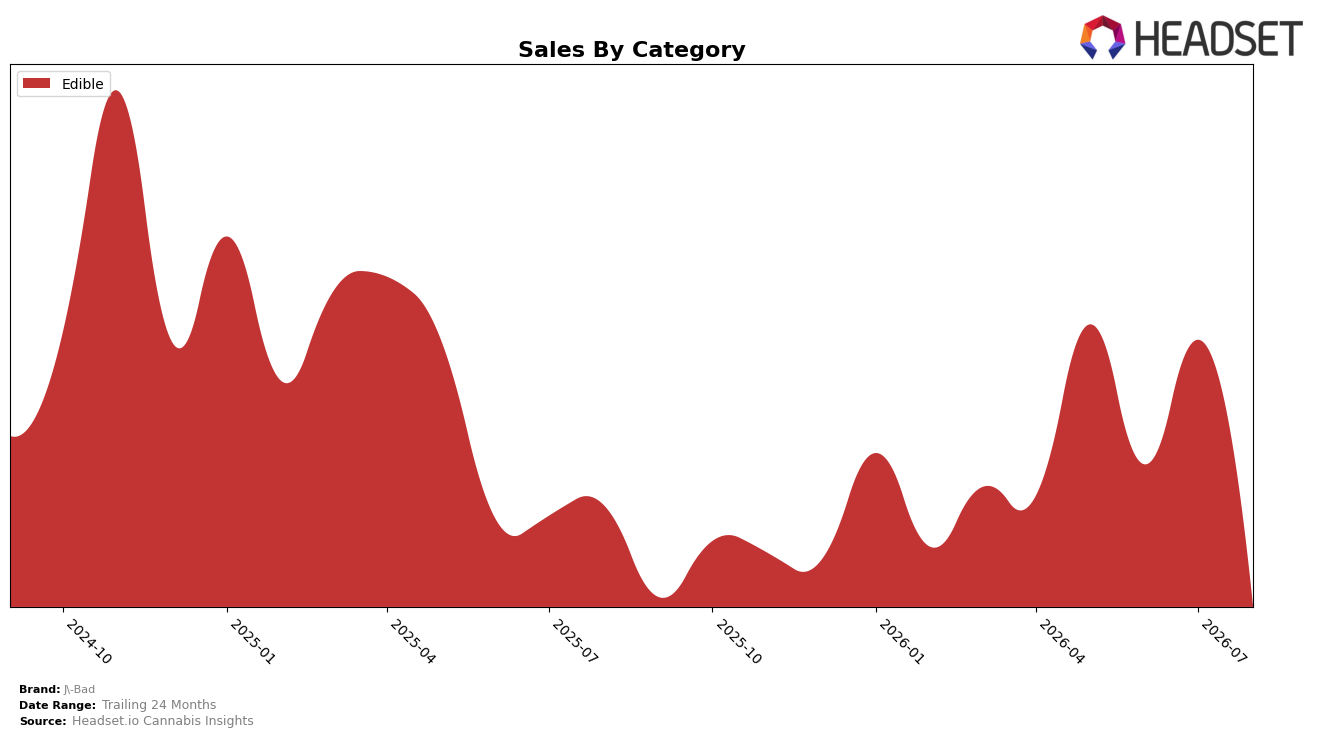
In August 2026, J-Bad’s mix was fully concentrated in Edible at 100.0% share, with category sales down 14.3% year over year and down 30.6% month over month, while average price fell 19.3% YoY to $22.86. Within Ohio Edibles, the brand sat at rank 32, indicating a mid-pack placement even as total brand sales declined 14.3% YoY and 30.6% MoM. The pattern implies a single-category dependency that magnifies monthly volatility and compresses pricing power, concentrating risk in Edibles rather than spreading it across adjacent formats.
With a 100.0% Edible mix and a 19.3% YoY price decrease alongside a 30.6% MoM sales contraction, J-Bad’s positioning skews toward price-led defense rather than assortment-led offense, which helps volume retention in softer demand but erodes value capture. Holding rank 32 in Ohio while sales fell 14.3% YoY suggests stable relative footing but weakening absolute performance; the implication is that to improve unit economics and reduce month-to-month swings, J-Bad needs either mix diversification beyond Edibles or tighter price-pack architecture within Edibles to curb further share erosion when demand dips.
Competitive Landscape
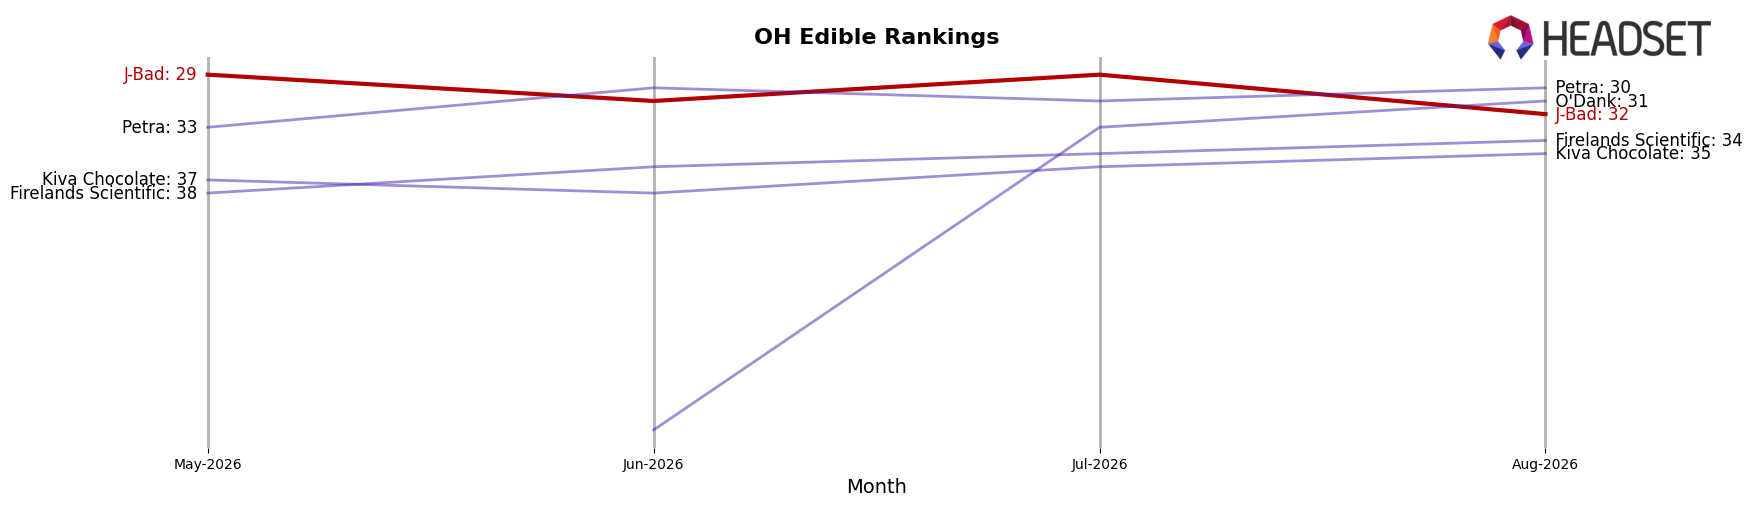
J-Bad sits at rank #32 in OH Edible for August 2026, slipping 2 positions year over year from #30 and down 3 spots versus the last three-month mark of #29, while remaining 10 places below its peak of #22 from January 2025. In contrast, Gron / Grön climbed from #8 to #1 with a 91.3% year-over-year sales increase, and Incredibles edged from #1 to #2 alongside a 3.4% year-over-year gain, indicating that J-Bad’s minor rank erosion coincides with competitors consolidating the top five; the pattern implies J-Bad’s trajectory is drifting toward the lower third unless it reclaims share against leaders expanding faster.
Notable Products
Sour Blue Razz Gummies 4-Pack (100mg) led August 2026 with a 134.98% month-over-month surge to rank 1, while Blue Razz Gummies 16-Pack (440mg) plunged 64.05% to rank 9. Peach Gummies 4-Pack (110mg) fell 51.67% but still held rank 2, and Strawberry Gummies 4-Pack (110mg) declined 32.98% at rank 3. With all top-10 items in the Edible category and both 4-Pack and 16-Pack formats represented, the pattern implies a pivot toward trial-size 4-Packs gaining velocity at the expense of larger 16-Packs.
Top Selling Cannabis Brands






Data for this report comes from real-time sales reporting by participating cannabis retailers via their point-of-sale systems, which are linked up with Headset’s business intelligence software. Headset’s data is very reliable, as it comes digitally direct from our partner retailers. However, the potential does exist for misreporting in the instance of duplicates, incorrectly classified products, inaccurate entry of products into point-of-sale systems, or even simple human error at the point of purchase. Thus, there is a slight margin of error to consider. Brands listed on this page are ranked in the top twenty within the market and product category by total retail sales volume.

