Jun-2026
Sales
Trend
6-Month
Product Count
SKUs
Avg Price
YoY Sales Change
YoY Price Change
Market Insights Snapshot
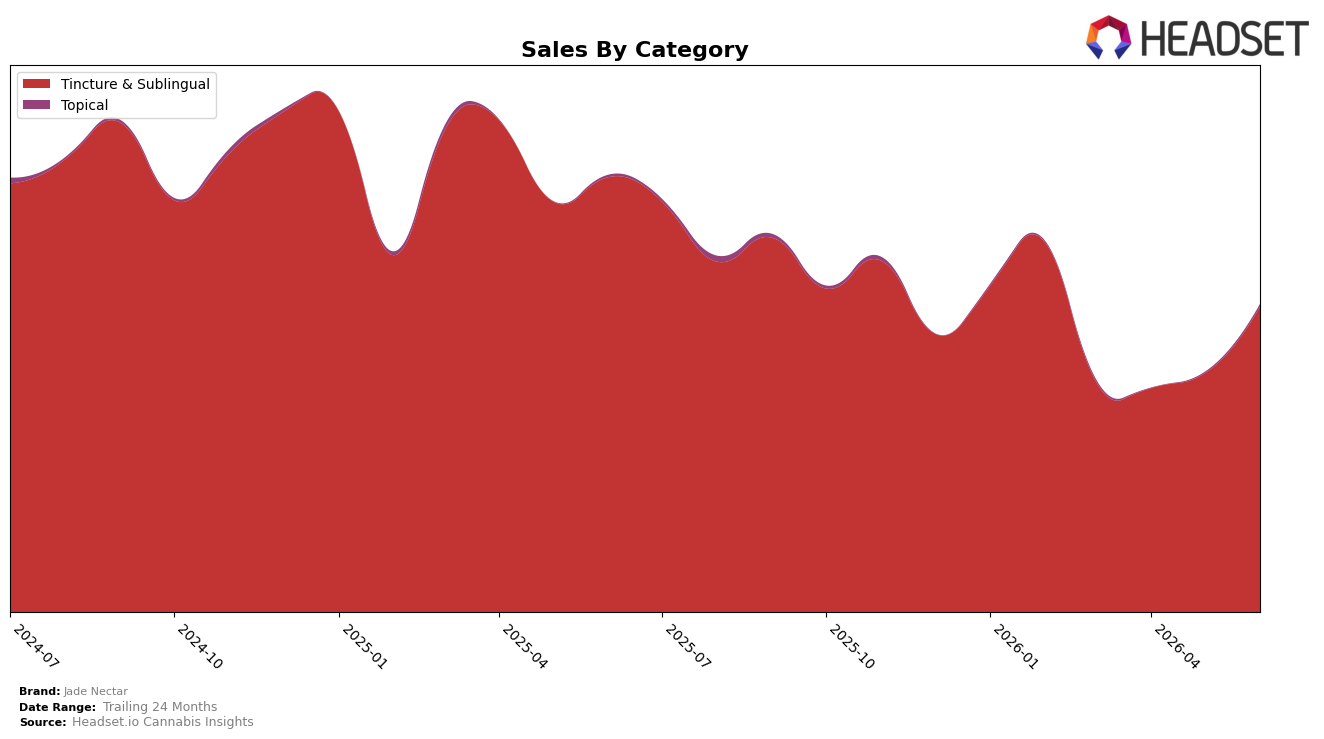
Jade Nectar concentrated 99.03% of June 2026 sales in Tincture & Sublingual, with Topical holding 0.97%, a mix that shifted despite a 27.90% month-over-month rebound in Tincture & Sublingual and an 84.69% month-over-month rise in Topical. Year over year, Tincture & Sublingual declined 29.74% while Topical grew 11.08%, indicating the brand’s MoM lift is concentrated in its core while the small Topical line expands from a low base; the pattern implies short-term momentum without structural diversification, as the overall brand sales fell 29.49% YoY and average price slipped 4.89% YoY.
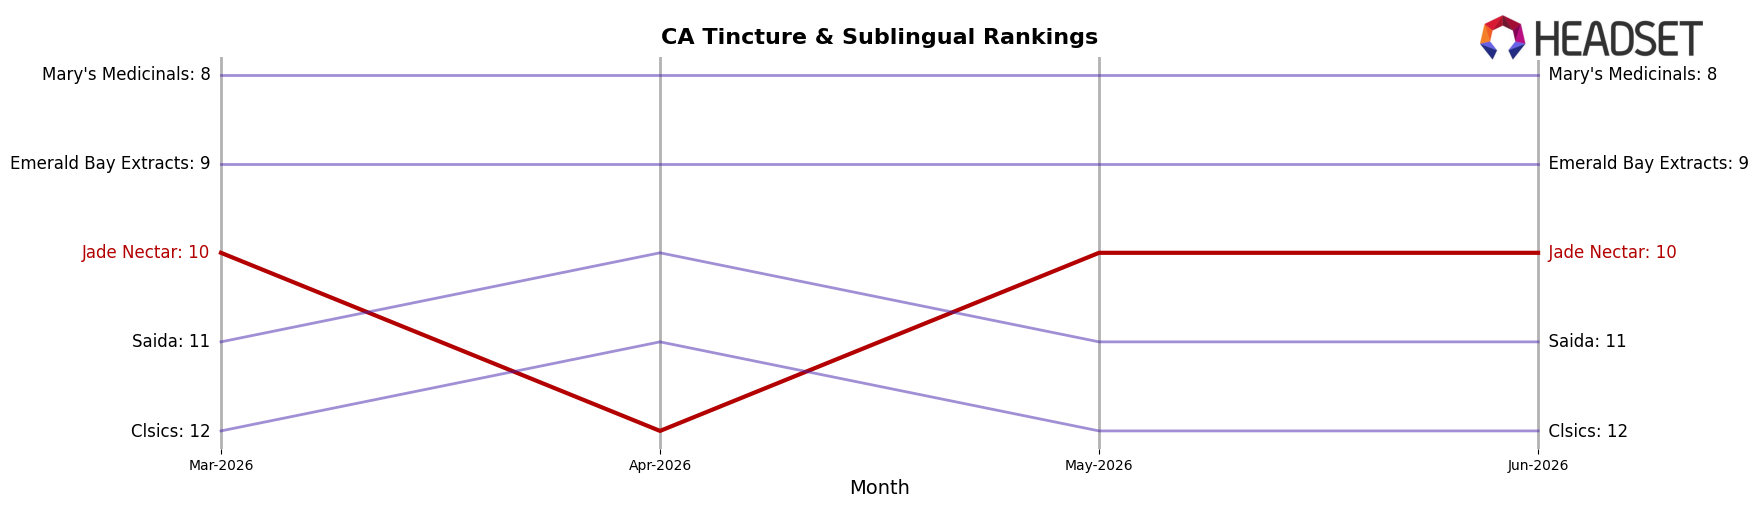
Within California Tincture & Sublingual, Jade Nectar sits at rank 10 while holding an average price of $28.29 alongside a 27.90% MoM lift in its dominant category and an 11.08% YoY gain in Topical; this combination points to reliance on a single category for scale and a narrow path to defend rank. The mix suggests price-led maintenance rather than expansion, as the 4.89% YoY price decline coincides with a 29.74% YoY contraction in the anchor category and only 0.97% share from Topical, implying the brand’s positioning risks compressing toward value at rank 10 unless Topical scales or Tincture & Sublingual recovers beyond MoM volatility.
Competitive Landscape
Jade Nectar sits at rank #10 in California Tincture & Sublingual for June 2026, down 1 position from #9 year over year, and flat versus March 2026 at #10, while its peak of #7 in September 2024 is 3 spots higher than today; in contrast, Papa & Barkley held #1 both this year and last despite a -9.7% year-over-year sales change, and ABX / AbsoluteXtracts climbed from #7 to #5 with +10.3% year-over-year sales growth, indicating Jade Nectar’s slight rank slippage amid stable recent positioning suggests share is being incrementally ceded to faster-improving mid-tier rivals rather than to the entrenched leader.
Notable Products
Sativa Tincture Drops (1000mg THC, 30ml) delivered the largest month-over-month gain at 139.7% to reach rank 3, outpacing Indica Tincture (450mg) at rank 2 with a 59.4% rise and eclipsing the rank-1 CBD/THC 30:1 CBD Drops (900mg CBD, 30mg THC, 30ml) which slipped 4.9% month over month. Four of the top ten are high-THC formulations, and every ranked SKU sits within Tincture & Sublingual, indicating concentration even as CBD-led options like rank-1 contract slightly while THC-forward items surge triple digits. CBD/THC 20:1 CBD Drops for Pets (300mg CBD, 15mg THC, 30ml) jumped 207.1% into rank 5, adding a new demand pocket alongside the $12,843 posted by Sativa Tincture Drops (1000mg THC, 30ml), while Indica Sativa High Potency Blend Tincture (1000mg THC, 30ml) in rank 4 grew a modest 1.3% compared with these outsized moves. The pattern implies Jade Nectar’s mix is tilting toward higher-THC and specialty use-cases, with momentum consolidating in a few fast-rising SKUs while the flagship CBD-heavy leader gives up share.
Top Selling Cannabis Brands
Data for this report comes from real-time sales reporting by participating cannabis retailers via their point-of-sale systems, which are linked up with Headset’s business intelligence software. Headset’s data is very reliable, as it comes digitally direct from our partner retailers. However, the potential does exist for misreporting in the instance of duplicates, incorrectly classified products, inaccurate entry of products into point-of-sale systems, or even simple human error at the point of purchase. Thus, there is a slight margin of error to consider. Brands listed on this page are ranked in the top twenty within the market and product category by total retail sales volume.

