Jun-2026
Sales
Trend
6-Month
Product Count
SKUs
Avg Price
YoY Sales Change
YoY Price Change
Market Insights Snapshot
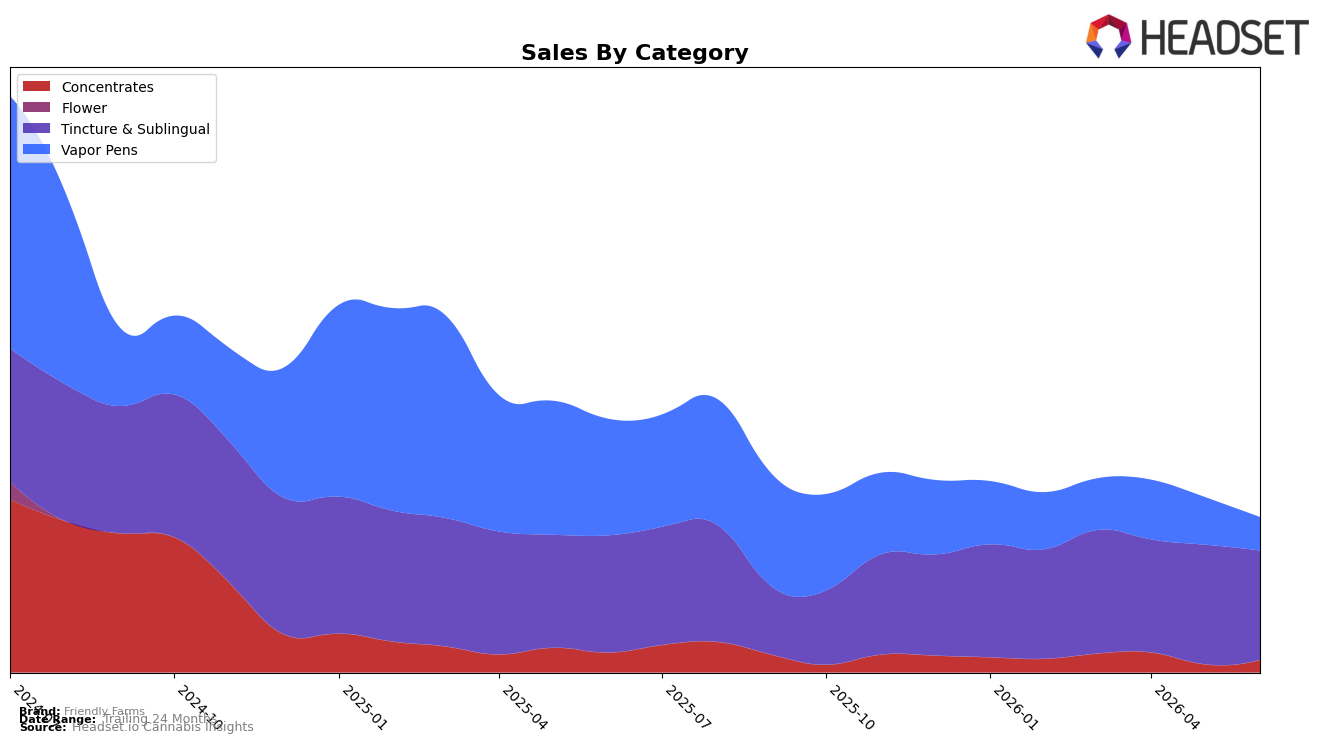
Friendly Farms concentrated 70.51% of June 2026 sales in Tincture & Sublingual, where year-over-year declined 6.64% and month-over-month fell 8.53%, while Vapor Pens held 21.51% share with a 71.42% YoY drop and a 30.06% MoM decline. Concentrates represented 7.98% share with a 37.45% YoY decline but a 55.07% MoM increase, and the brand’s average price moved down 4.71% YoY to $28.37. With Tincture & Sublingual ranked 6 in California and Vapor Pens contracting sharply, the mix implies a pivot toward stabilizing tincture demand and opportunistic recovery in concentrates despite broader brand sales falling 38.85% YoY.
The accelerating retreat in Vapor Pens (−71.42% YoY, −30.06% MoM) alongside a smaller pullback in Tincture & Sublingual (−6.64% YoY, −8.53% MoM) suggests Friendly Farms’ positioning is moving away from volatile inhalables toward formats where a rank of 6 provides sustained visibility. The 55.07% MoM rebound in Concentrates, despite a 37.45% YoY decline and a lower average price point than the brand overall, indicates room to redeploy attention to value-led extract shoppers while the 4.71% YoY price decrease supports retention in tinctures; together, these shifts imply a reweighting toward depth in Tincture & Sublingual with selective, margin-aware experimentation in Concentrates.
Competitive Landscape
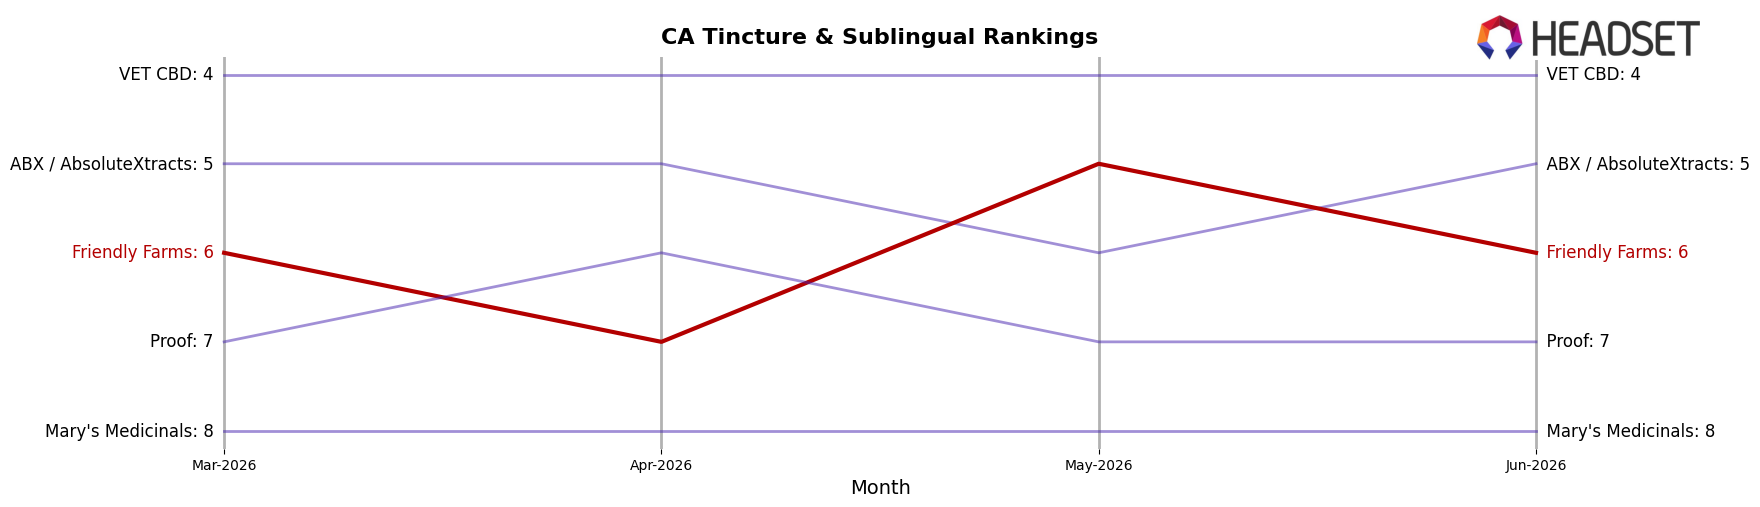
Friendly Farms is ranked #6 in California Tincture & Sublingual for June 2026, unchanged from #6 year over year, and has held #6 for three consecutive months while peaking at #5 in May 2026; meanwhile, ABX / AbsoluteXtracts improved from #7 to #5 year over year and Yummi Karma maintained #2 as its sales grew 3.27% YoY. At the top, Papa & Barkley stayed at #1 despite a 9.74% YoY sales decline, and Care By Design held #3 with a 9.59% YoY sales dip, indicating that Friendly Farms’ flat rank alongside mixed competitor momentum implies a stable but pressurized position where incremental share gains are necessary to break back above #6.
Notable Products
Blue Dream Full Spectrum Tincture (1000mg THC, 30ml) posted the largest movement in June 2026 with a +68.5% month-over-month surge into rank 1, while Bubba Kush Full Spectrum Tincture (1000mg THC, 30ml) fell -50.1% into rank 7. Zlicious Tincture (1000mg) contracted -26.0% while Northern Lights Tincture (1000mg) rose +43.9% at a shared rank 5, and eight of the top ten SKUs are Tincture & Sublingual variants from the same full-spectrum family. The concentration of gains at the top alongside sharp mid-pack volatility implies Friendly Farms is consolidating around a flagship tincture while pruning or repositioning slower-moving flavors.
Top Selling Cannabis Brands
Data for this report comes from real-time sales reporting by participating cannabis retailers via their point-of-sale systems, which are linked up with Headset’s business intelligence software. Headset’s data is very reliable, as it comes digitally direct from our partner retailers. However, the potential does exist for misreporting in the instance of duplicates, incorrectly classified products, inaccurate entry of products into point-of-sale systems, or even simple human error at the point of purchase. Thus, there is a slight margin of error to consider. Brands listed on this page are ranked in the top twenty within the market and product category by total retail sales volume.

