.svg)

Sep-2026
Sales
Trend
6-Month
Product Count
SKUs
Avg Price
YoY Sales Change
YoY Price Change


Where to Buy
Keef Cola is stocked at 1,665 licensed dispensaries across Colorado, Michigan, and 14 other states, 320 of them in Colorado, with the deepest coverage in Denver, Colorado Springs, Boulder, Aurora, and Durango. Search by ZIP code or city below to find the closest one, or filter by product type if you are after a specific format.
Market Insights Snapshot
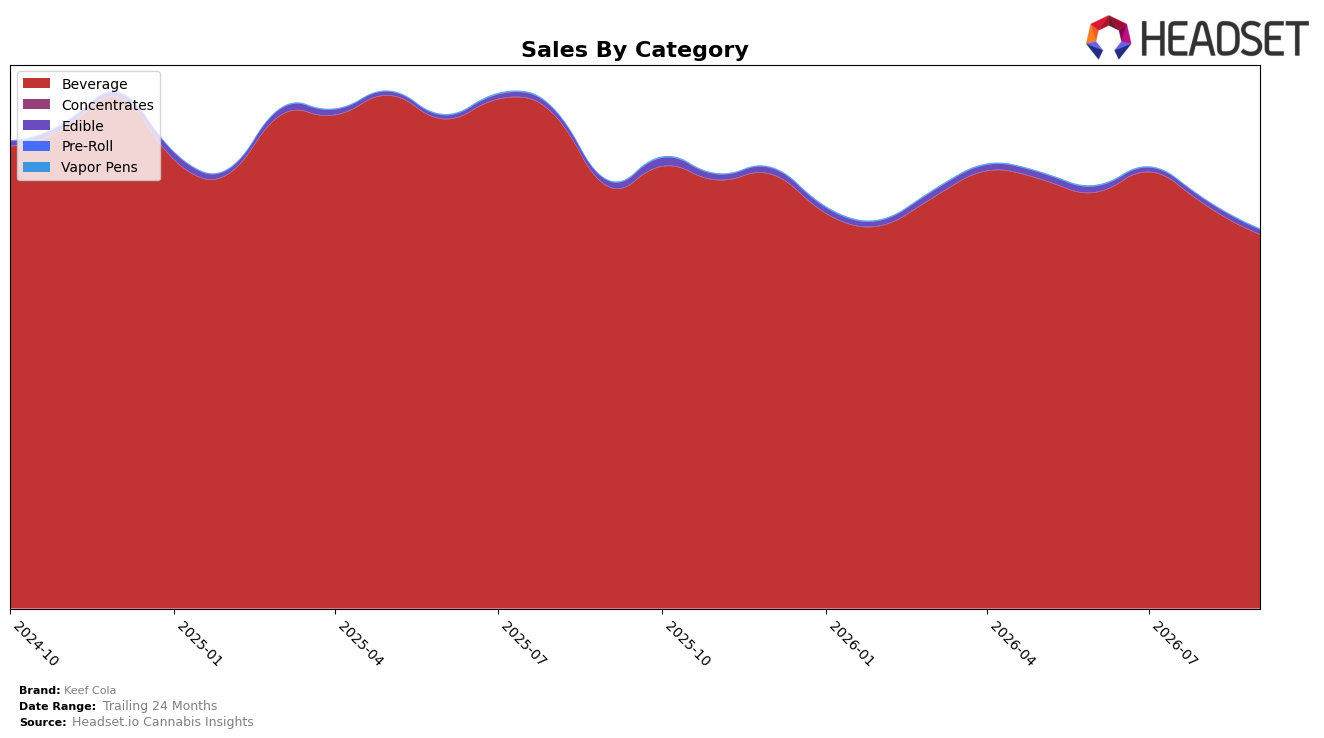
Keef Cola’s category mix in September 2026 is highly concentrated in Beverage at 98.83% share with a year-over-year decline of 11.38% and a month-over-month drop of 7.42%, while Edible holds 1.11% share with a 15.51% YoY contraction and a 2.98% MoM decline; conversely, Vapor Pens, though only 0.06% share, rose 184.88% YoY and 125.58% MoM. Average price across the portfolio decreased 2.89% YoY to $9.33, with Beverage pricing at $9.31 and Edible at $10.13, and rank position in Beverage is 1 in Arizona. The pattern implies concentration risk: small absolute shifts in Beverage drive overall results downward (-11.39% brand YoY), while the outsized growth rates in Vapor Pens are too small in share to offset the Beverage drag, signaling an exposure that keeps Keef Cola’s top-line aligned with Beverage’s monthly volatility.
The shift toward steep Beverage declines (-11.38% YoY, -7.42% MoM) alongside minimal Edible weight (1.11% share) and fast-growing but tiny Vapor Pens (0.06% share, +125.58% MoM) implies that Keef Cola’s current positioning is anchored to large-volume, lower-price Beverage where price deflation (-2.89% YoY) and category softness transmit directly into rank-sensitive outcomes despite a number 1 Beverage rank in Arizona. The implication is that without lifting Beverage mix efficiency or scaling the high-growth Vapor Pens contribution from 0.06% toward even a low single-digit share, September 2026 dynamics will keep margin and share leverage muted, because double- and triple-digit growth in micro-scale segments cannot counter a single-digit share loss in a 98.83% base.
Competitive Landscape
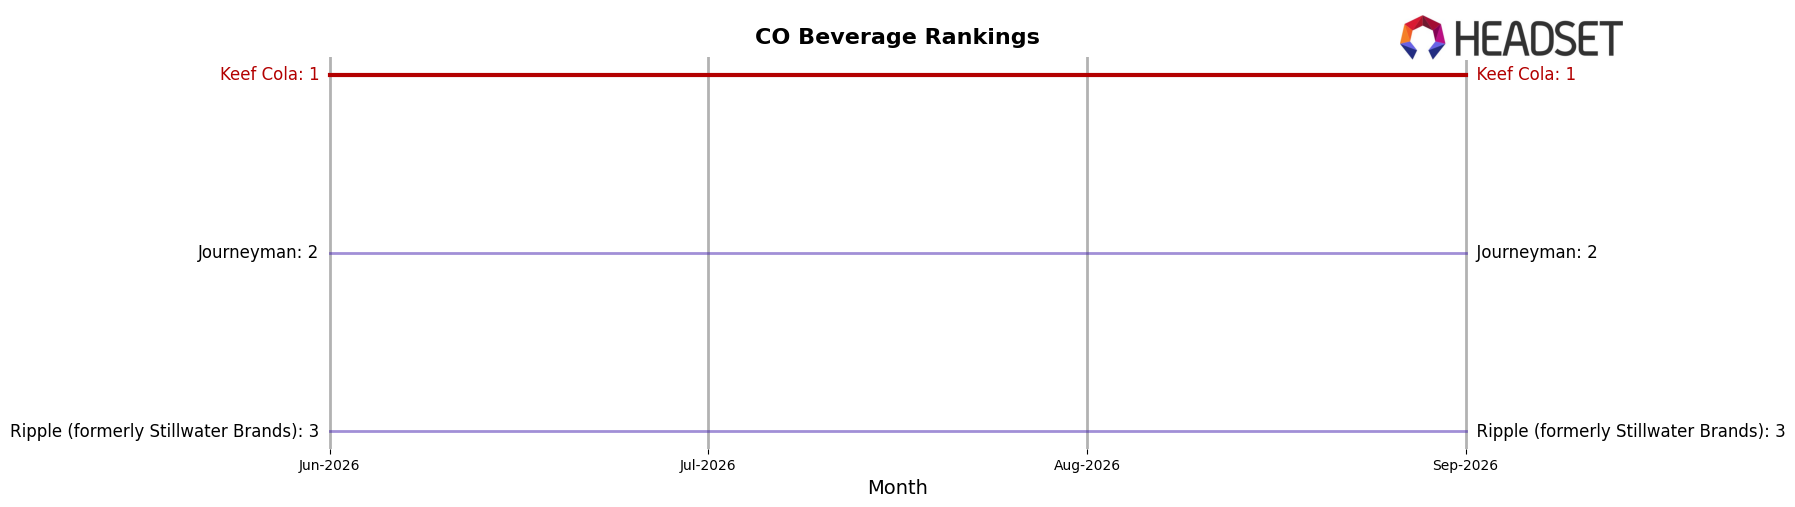
Keef Cola holds rank #1 in CO Beverage in September 2026 and is flat year over year at #1, while Journeyman sits at #2 and Ripple (formerly Stillwater Brands) slipped from #2 to #3 alongside a -23.36% year-over-year sales change; additionally, Dialed In Gummies declined from #3 to #5 with a -22.40% sales drop. With Keef Cola also at #1 three months ago and reaching its peak rank of #1 in September 2026, the combination of a 0-position YoY change and competitors’ downward rank shifts indicates that Keef Cola’s leadership is being reinforced more by rivals losing share than by incremental rank gains, implying defensible incumbency rather than expansion-led momentum.
Notable Products
Classic - Pineapple X-Press Cola Soda (10mg THC, 12oz, 355ml) posted the sharpest move in September 2026 with a -17.0% month-over-month change while sitting at rank 7, contrasting with Xtreme - Bubba Kush Root Beer Classic Soda (100mg THC, 12oz, 355ml) at rank 1 with a -3.1% decline. Orange Kush Classic Soda (10mg THC, 12oz, 355ml) held rank 2 but fell -11.3% MoM, while Xtreme - Orange Kush Classic Soda (100mg THC, 12oz, 355ml) at rank 5 dropped -10.4%, indicating pressure across both 10mg and 100mg formats. Nine of the top ten SKUs are Beverage sodas within the Classic and Xtreme families, and the absence of any +50% mover alongside multiple declines greater than -10% implies the portfolio is consolidating around core flavors rather than expanding velocity through innovation.
Top Selling Cannabis Brands






Data for this report comes from real-time sales reporting by participating cannabis retailers via their point-of-sale systems, which are linked up with Headset’s business intelligence software. Headset’s data is very reliable, as it comes digitally direct from our partner retailers. However, the potential does exist for misreporting in the instance of duplicates, incorrectly classified products, inaccurate entry of products into point-of-sale systems, or even simple human error at the point of purchase. Thus, there is a slight margin of error to consider. Brands listed on this page are ranked in the top twenty within the market and product category by total retail sales volume.

