.svg)

Sep-2026
Sales
Trend
6-Month
Product Count
SKUs
Avg Price
YoY Sales Change
YoY Price Change


Where to Buy
Ript is stocked at 133 licensed dispensaries across Colorado, with the deepest coverage in Denver, Grand Junction, Pueblo, Pueblo West, and Boulder. Search by ZIP code or city below to find the closest one, or filter by product type if you are after a specific format.
Market Insights Snapshot
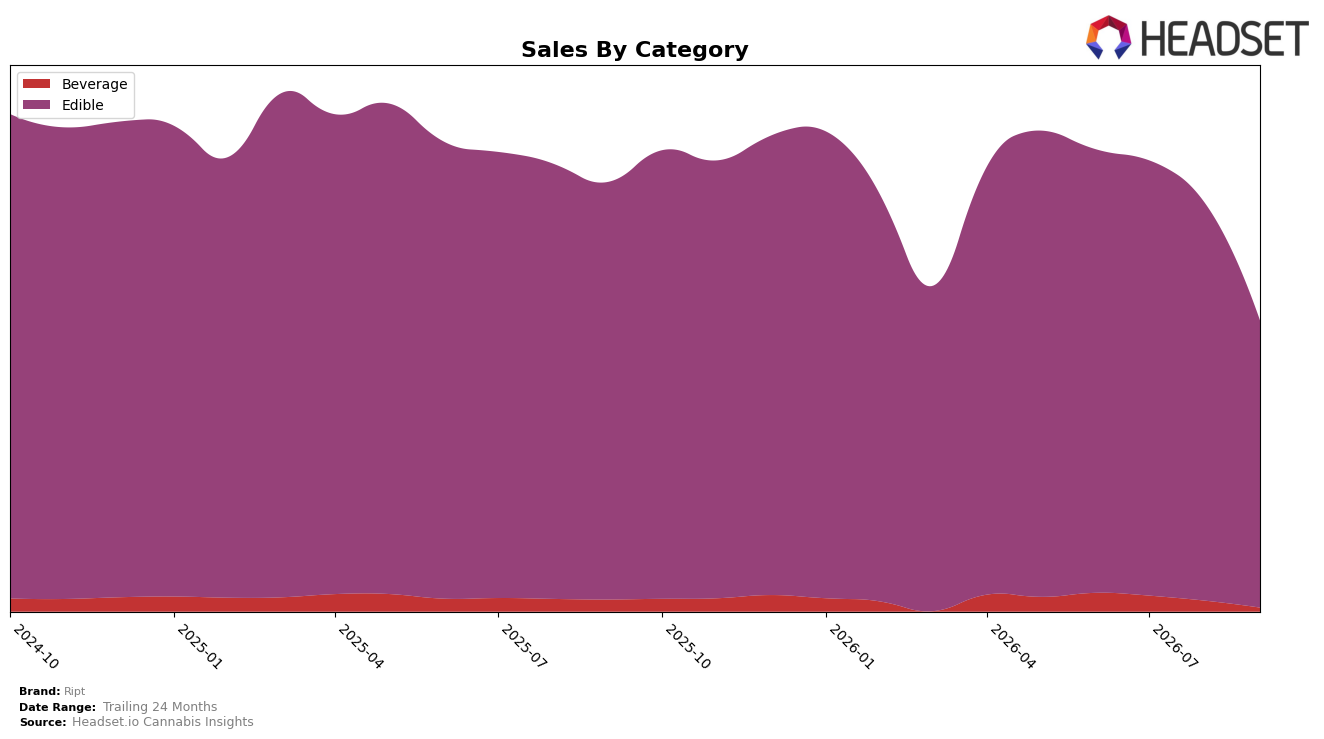
In September 2026, Ript concentrated 98.22% of sales in Edible while Beverage accounted for 1.78%, with Edible down 31.15% year over year and 27.77% month over month, and Beverage falling 60.70% year over year and 57.18% month over month. Despite a 2.20% year-over-year decrease in average price to $7.82 and an overall brand sales decline of 32.06% year over year, Edible still anchored the mix as the top category in Colorado; the pattern implies Ript is doubling down on Edible even as both categories contract, narrowing optionality and heightening sensitivity to Edible-specific headwinds.
Holding rank 4 in Edible within Colorado while Edible share sits at 98.22% and Beverage slumps 57.18% month over month indicates a positioning concentrated in value-priced Edible, with the slight 2.20% price deflation suggesting competitive price-matching rather than premiumization. The combination of a 27.77% Edible month-over-month drop alongside a 60.70% Beverage year-over-year decline implies Ript’s near-term growth ceiling depends on stabilizing Edible velocity within rank 4 rather than expecting diversification from Beverage, so the positioning signal is scale-through-core SKUs rather than portfolio breadth.
Competitive Landscape
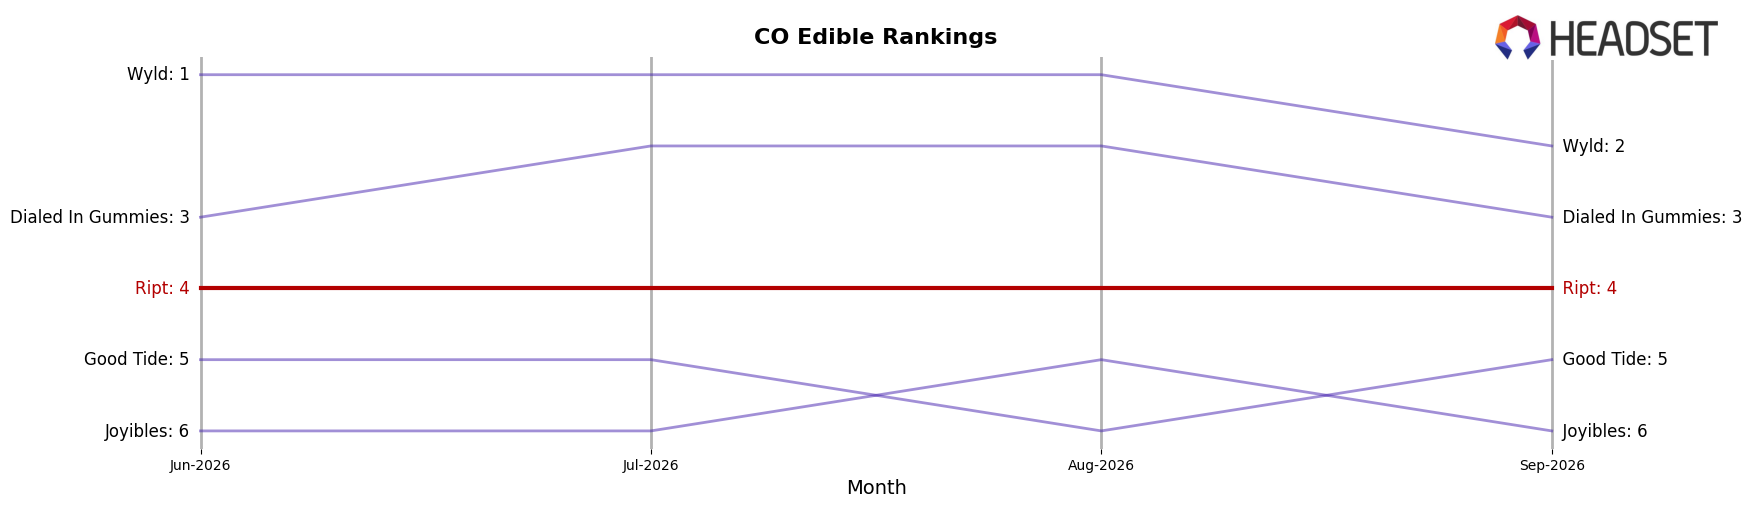
Ript sits at rank #4 in Colorado Edible in September 2026, unchanged from #4 in September 2025, and it has also held #4 for the last three months, indicating a flat rank trajectory while peers reshuffled; Wana climbed from #2 to #1 with a 10.5% year-over-year sales increase, whereas Wyld slipped from #1 to #2 alongside a 23.8% sales decline, and Dialed In Gummies held #3 with 30.6% growth. With Ript at its peak rank of #4 in September 2026 and Good Tide remaining at #5 amid a 14.0% decline, the stability at #4 despite upward and downward moves around it implies Ript is capped by faster-growing incumbents above and insulated by weaker momentum below, signaling a need to unlock share gains to break out of a mid-tier ceiling.
Notable Products
Pucked Up Peach Gummies 10-Pack (100mg) posted the sharpest movement in September 2026 with a -51.9% month-over-month drop and fell to rank 8, while Sleep - CBD/CBN/THC 1:1:2 Knockout Punch Gummies 10-Pack (50mg CBD, 50mg CBN, 100mg THC) slid -46.5% at rank 9. At the top, Blazed Blue Raz Gummies 10-Pack (100mg) held rank 1 despite a -24.9% decline, and Faded Fruit Punch Gummies 10-Pack (100mg) stayed at rank 2 with a -28.4% decline; together with Baked Apple Gummies 10-Pack (100mg) at rank 3 and -23.5%, four of the top five are Edible gummies signaling concentrated reliance on a single format. The dollar leader generated $119,679 alongside a -24.9% contraction, and with Plus - CBD/CBG/THC 1:1:1 Strawberry Fieldtrip Gummies 10-Pack (100mg CBD, 100mg CBG, 100mg THC) down -49.5% at rank 10, September 2026 skewed toward broad pullbacks rather than isolated SKU weakness. The pattern implies Ript’s commercial direction is over-weighted to Edible gummies where demand is softening, suggesting near-term mix diversification or pricing adjustments may be required to stabilize rank position and volume.
Top Selling Cannabis Brands






Data for this report comes from real-time sales reporting by participating cannabis retailers via their point-of-sale systems, which are linked up with Headset’s business intelligence software. Headset’s data is very reliable, as it comes digitally direct from our partner retailers. However, the potential does exist for misreporting in the instance of duplicates, incorrectly classified products, inaccurate entry of products into point-of-sale systems, or even simple human error at the point of purchase. Thus, there is a slight margin of error to consider. Brands listed on this page are ranked in the top twenty within the market and product category by total retail sales volume.

