Market Insights Snapshot
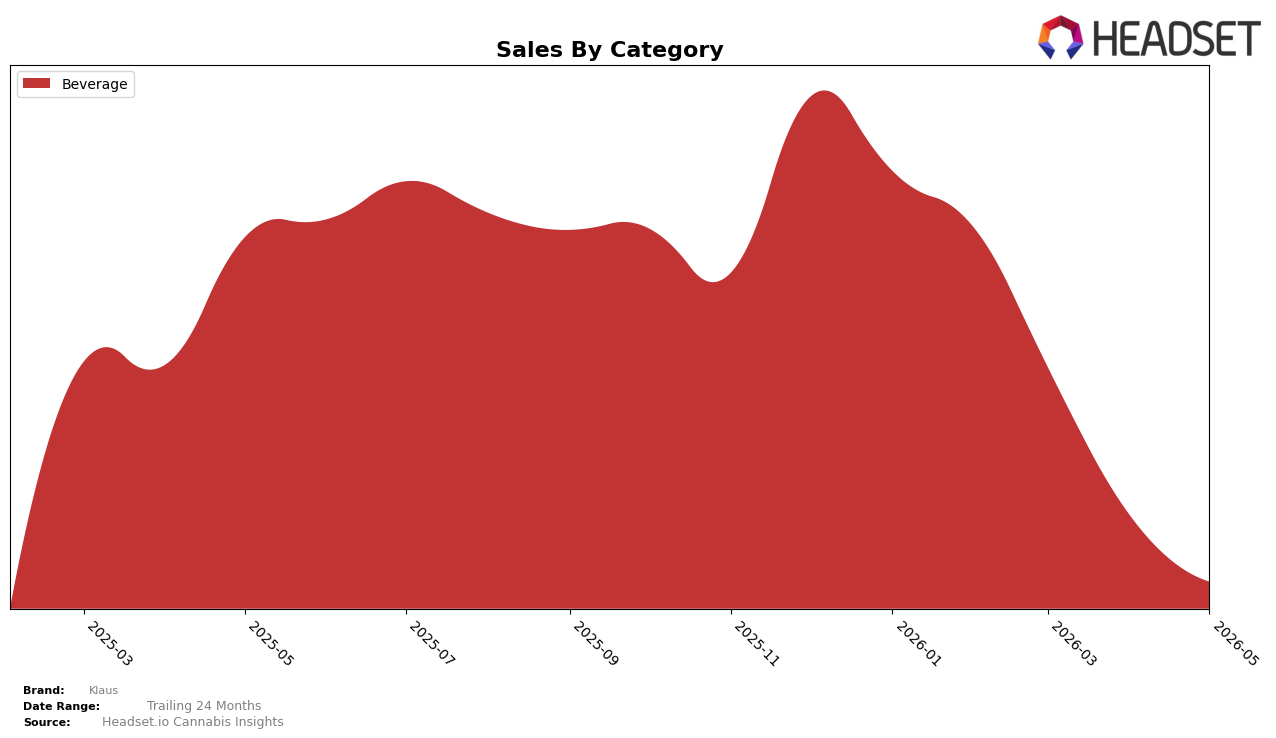
In May 2026, Klaus operated as a single-category brand with Beverage accounting for 100.0% category share, while sales in Beverage declined 87.55% year over year and 57.34% month over month; alongside this, average price contracted 4.85% year over year. With no offsetting categories to balance volatility, the full-brand exposure to a single category amplified the 87.55% YoY decline and the 57.34% MoM drop within Beverage, implying concentration risk that is acutely tied to month-to-month category swings.
The pattern implies Klaus’s positioning is narrowly anchored to Beverage dynamics, where a 100.0% mix concentrates all pricing and demand elasticities into one lane, and the 4.85% YoY price decrease did not mitigate the 57.34% MoM and 87.55% YoY sales contractions. This combination suggests the brand’s current stance functions more as a pure-play Beverage participant than a portfolio balancer, where stabilization would require either recovering velocity within Beverage or introducing category diversification to reduce exposure to single-category downturns.
Competitive Landscape
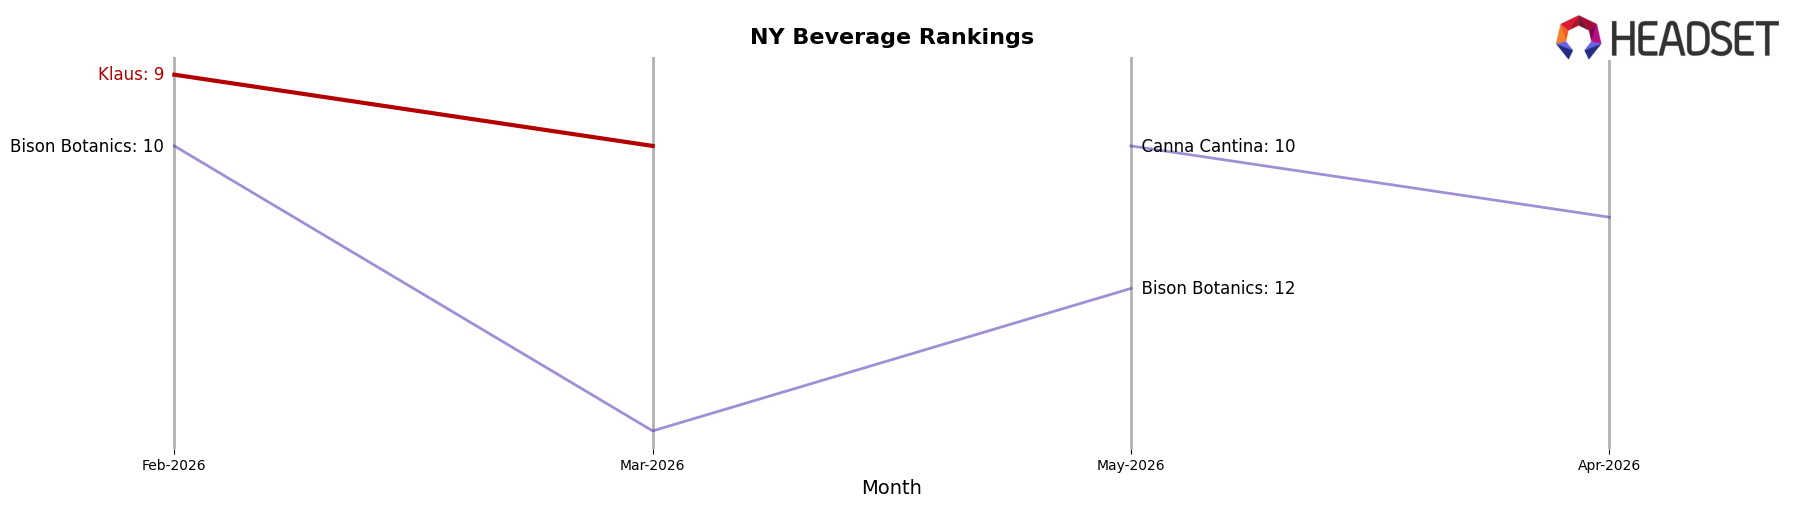
Klaus is ranked #16 in NY Beverage in May 2026, down 7 spots year over year from #9, and 7 spots below its rank from February 2026 when it was also #9; this sits 8 positions off its historical peak of #8 from March 2025. Meanwhile, Ayrloom held at #1 year over year while growing sales by 8.6%, and Layup climbed from #3 to #2 with a 306.1% sales increase, whereas Tune fell from #2 to #5 alongside a 43.9% sales decline; these shifts indicate Klaus is losing rank share amid an upward push from faster-scaling rivals and must arrest multi-quarter slippage to avoid further mid-tier erosion.
Notable Products
1851 Zombie Mocktail (10mg THC, 12oz, 355ml) posted the steepest movement in May 2026 with a -71.6% month-over-month change while dropping to rank 2, and Mezzrole Mocktail (10mg THC, 12oz, 355ml) followed with a -62.5% decline at rank 3; by contrast, Bosphorus Mocktail (10mg THC, 12oz, 355ml) held rank 1 despite a -35.2% slide. All three top-3 SKUs are Beverages, and with three of the top ten concentrated in a single mocktail family, the category’s synchronized declines indicate over-reliance on a narrow lineup. The $1,398 in May 2026 sales for Bosphorus Mocktail came alongside rank stability at 1 and a deeper rank gap over the falling number 2, implying demand is consolidating into a single hero SKU rather than supporting breadth. The pattern points to a commercial direction where Klaus is trading category presence for a single-SKU anchor, suggesting the brand needs either price-pack or flavor innovation to stabilize the tail of its beverage range.
Top Selling Cannabis Brands
Data for this report comes from real-time sales reporting by participating cannabis retailers via their point-of-sale systems, which are linked up with Headset’s business intelligence software. Headset’s data is very reliable, as it comes digitally direct from our partner retailers. However, the potential does exist for misreporting in the instance of duplicates, incorrectly classified products, inaccurate entry of products into point-of-sale systems, or even simple human error at the point of purchase. Thus, there is a slight margin of error to consider. Brands listed on this page are ranked in the top twenty within the market and product category by total retail sales volume.

