Market Insights Snapshot
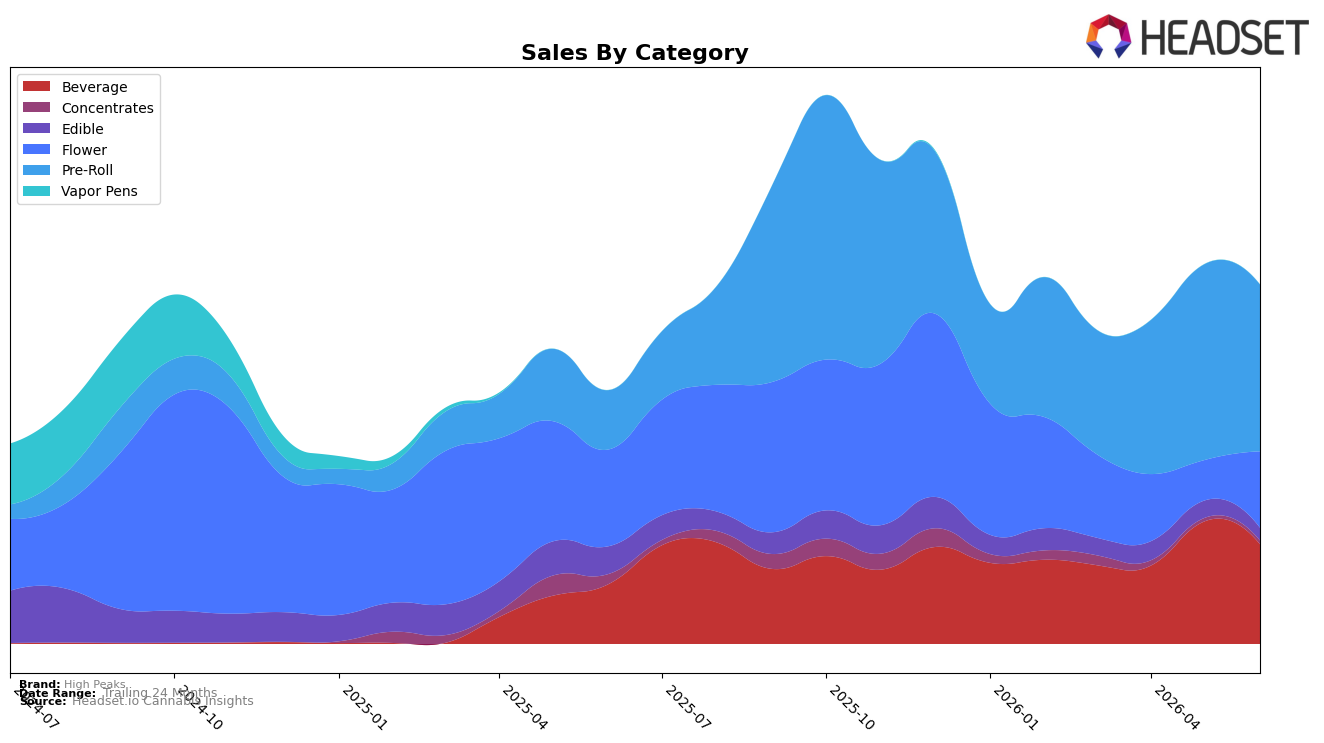
High Peaks concentrated nearly half of June 2026 sales in Pre-Roll at 46.51% share with 181.86% year-over-year growth, even as month-over-month slipped 14.87%, while Beverage held 27.76% share with 67.23% year-over-year growth and an 18.76% month-over-month decline. Flower expanded to 21.25% share on an 89.34% month-over-month jump despite a 21.15% year-over-year contraction, whereas Edible fell to 3.50% share with a 54.40% year-over-year drop and a 26.86% month-over-month decline. The mix indicates High Peaks is pivoting toward inhalables for June 2026, using Pre-Roll momentum to offset Beverage and Edible pullbacks as overall brand sales rose 41.84% year over year.
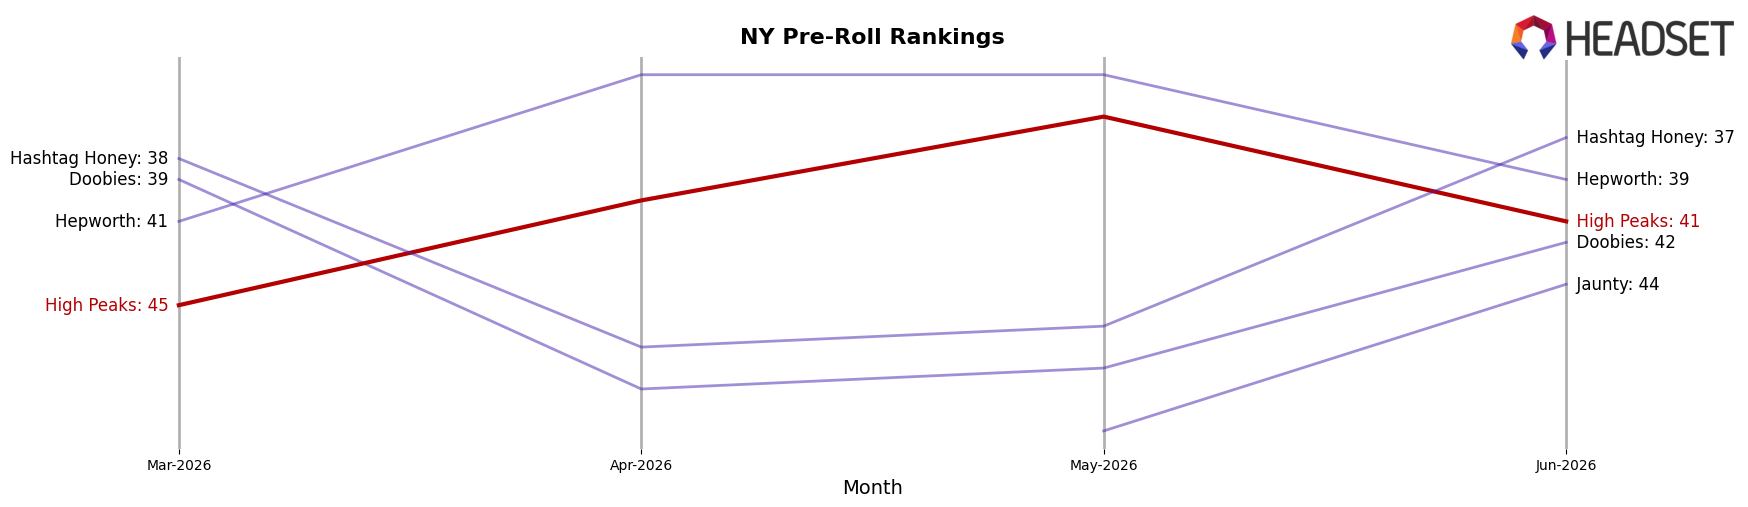
With Pre-Roll ranked 41 in New York and carrying a 46.51% share of brand sales, dependence on a mid-pack position creates exposure if month-over-month softness in Pre-Roll (down 14.87%) persists, while the 89.34% month-over-month rebound in Flower suggests headroom to rebalance mix away from categories with double-digit month-over-month declines like Beverage (down 18.76%). The 12.99% year-over-year average price decrease paired with category shifts toward lower-ticket formats such as Beverage (average price $4.66) and away from Edible (down 54.40% year over year) implies a value-led positioning that can be diversified by nurturing Flower’s regained velocity and stabilizing Pre-Roll to reduce reliance on a single category for growth.
Competitive Landscape
High Peaks sits at rank #41 in NY Pre-Roll in June 2026, improving 32 positions from #73 year over year, and edging up 4 spots from #45 in March 2026, while still 14 places below its peak at #27 in October 2025; in contrast, Ruby Farms holds #1 with a 0-position YoY change and 15.6% YoY sales growth, and Anthem jumped from #40 to #3 alongside an 852.1% YoY sales surge, indicating that High Peaks’ upward rank trajectory is real but lagging leaders that are either entrenched at the top or accelerating faster, implying the brand is recovering share but not yet converting it into top-tier placement momentum.
Notable Products
AJ Sour Diesel Pre-Roll 2-Pack (1.5g) posted the sharpest move in June 2026 with +153.5% month over month to rank 5, while CBD/THC 1:2 Frescanna Ruby Grapefruit Sparking Drink (5mg CBD, 10mg THC, 12oz) fell -51.4% and sat at rank 4. The top beverage, CBD/THC 1:1 Sparkling Strawberry Lemonade (5mg CBD, 5mg THC, 12oz), slid -11.5% at rank 1, and CBD/THC 1:2 Sparkling Strawberry Lemonade (5mg CBD, 10mg THC, 12oz) dropped -15.0% at rank 2; four of the top ten are Beverage SKUs, but the only category posting a triple-digit gainer is Pre-Roll. With Sasquatch Breath Pre-Roll 2-Pack (1.5g) down -24.3% at rank 9 even as AJ Sour Diesel adds an estimated $44,419, the volatility within Pre-Rolls contrasts with broadly negative Beverage momentum. The pattern implies a commercial pivot opportunity toward selective Pre-Roll bets over broad Beverage extensions, concentrating spend behind fast-rising formats rather than defending declining lemonade variants.
Top Selling Cannabis Brands
Data for this report comes from real-time sales reporting by participating cannabis retailers via their point-of-sale systems, which are linked up with Headset’s business intelligence software. Headset’s data is very reliable, as it comes digitally direct from our partner retailers. However, the potential does exist for misreporting in the instance of duplicates, incorrectly classified products, inaccurate entry of products into point-of-sale systems, or even simple human error at the point of purchase. Thus, there is a slight margin of error to consider. Brands listed on this page are ranked in the top twenty within the market and product category by total retail sales volume.

