Market Insights Snapshot
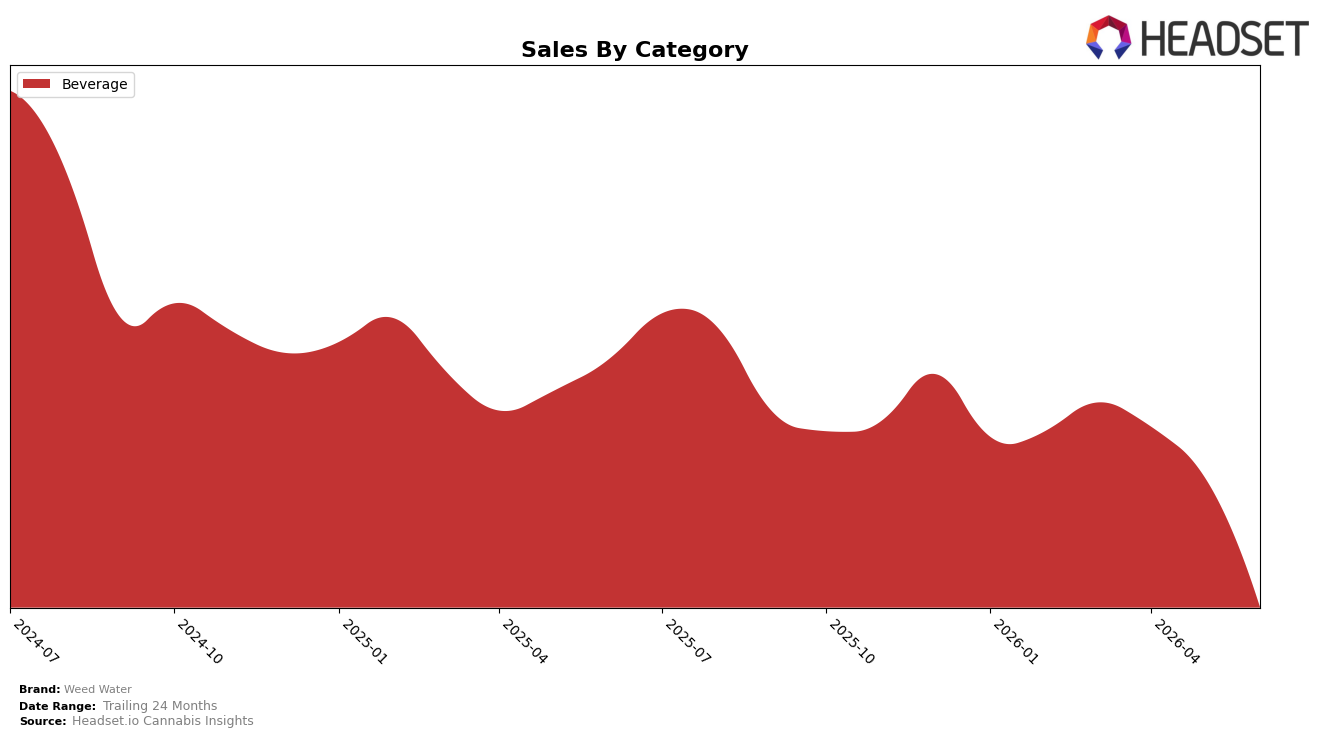
In June 2026, Weed Water operated as a single-category brand with Beverage at 100.0% of sales share, down by 79.5% year over year and 67.1% month over month, while average price fell 15.8% YoY. With no diversification outside Beverage and no listed rank in New York Beverage, the combination of a 100.0% concentration and a double-digit MoM contraction suggests a demand shock rather than a mix shift, implying that category exposure rather than intra-portfolio reallocation is dictating outcomes.
The sharp MoM drop of 67.1% alongside a 79.5% YoY decline, paired with a 15.8% YoY price reduction, indicates discounting is not translating to volume recovery and that single-category dependence is amplifying volatility, especially with a null rank signaling limited shelf or distribution presence. The pattern implies Weed Water’s positioning is overly tethered to Beverage seasonality and retail access dynamics in New York, where a lack of alternative category footholds and no recorded rank leave the brand exposed to further share erosion if June 2026 conditions persist.
Competitive Landscape
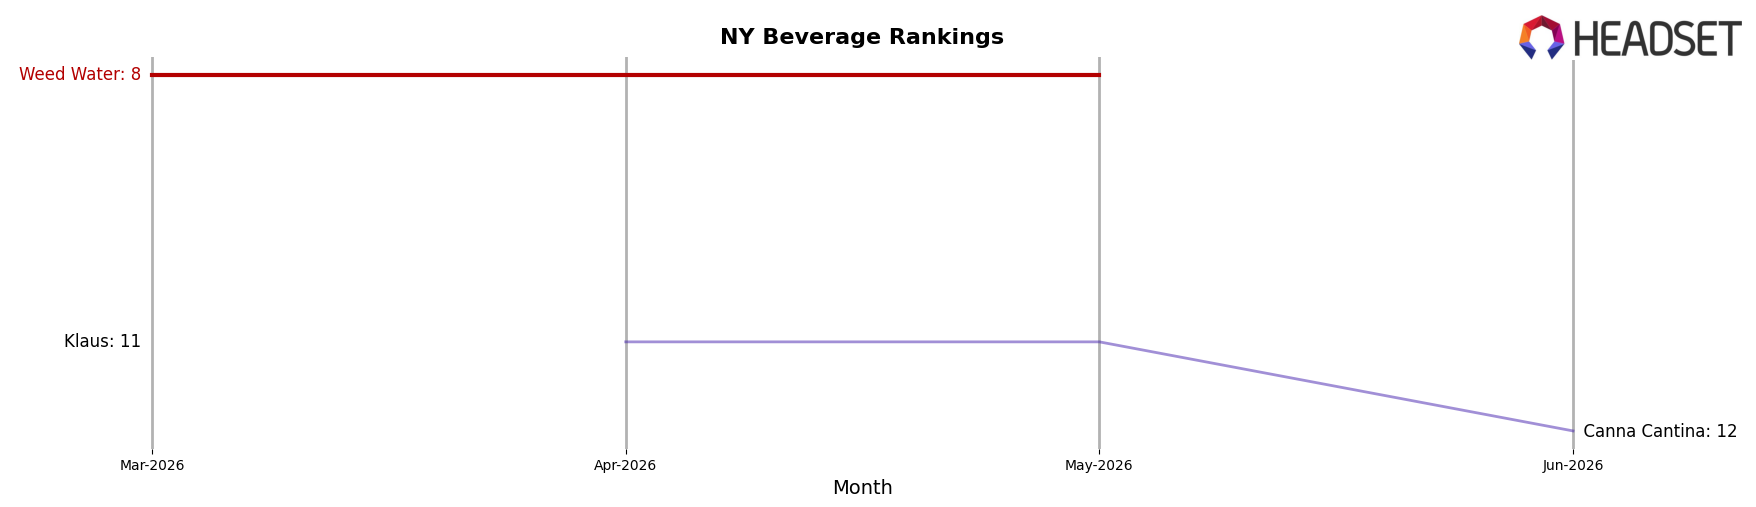
Weed Water sits at rank #15 in NY Beverage in June 2026, down 7 positions year over year from #8 and falling 7 spots since March 2026 from #8, despite a historical peak at #3 in August 2024; in contrast, Ayrloom held #1 with a 60.2% YoY sales increase while Layup advanced from #3 to #2 alongside a 319.4% YoY surge, indicating Weed Water’s rank erosion is occurring while leaders consolidate share and fast growers climb. This pattern implies Weed Water’s trajectory is one of relative displacement: without a reversal that regains at least 5–7 ranks in the next two quarters, the brand risks entrenchment outside the top 10 as momentum concentrates at the top.
Notable Products
CBG/THC 1:1 Yuzu Peach Deez Sparkling Water (5mg CBG, 5mg THC, 7.5oz) posted the steepest decline, falling 73.7% month over month while holding rank 2, as CBD/THC 1:1 Berry Rntz Sparkling Water (5mg CBD, 5mg THC, 12oz, 355ml) dropped 60.8% yet remained rank 1. With the top two SKUs both in Beverage and each losing over 60%, the category concentration at ranks 1 and 2 amplifies downside when demand softens. The absence of the CBD/THC 1:1 Berry Rntz Sparkling Water 4-Pack from the rankings alongside $3,886 in single-can sales suggests a consumer pivot toward trial-size purchases over multipacks. The pattern implies Weed Water’s commercial direction is skewing toward smaller-format, single-unit Beverage plays that need price-pack architecture or innovation to reduce volatility concentrated in the top two ranks.
Top Selling Cannabis Brands
Data for this report comes from real-time sales reporting by participating cannabis retailers via their point-of-sale systems, which are linked up with Headset’s business intelligence software. Headset’s data is very reliable, as it comes digitally direct from our partner retailers. However, the potential does exist for misreporting in the instance of duplicates, incorrectly classified products, inaccurate entry of products into point-of-sale systems, or even simple human error at the point of purchase. Thus, there is a slight margin of error to consider. Brands listed on this page are ranked in the top twenty within the market and product category by total retail sales volume.

