Jun-2026
Sales
Trend
6-Month
Product Count
SKUs
Avg Price
YoY Sales Change
YoY Price Change
Market Insights Snapshot
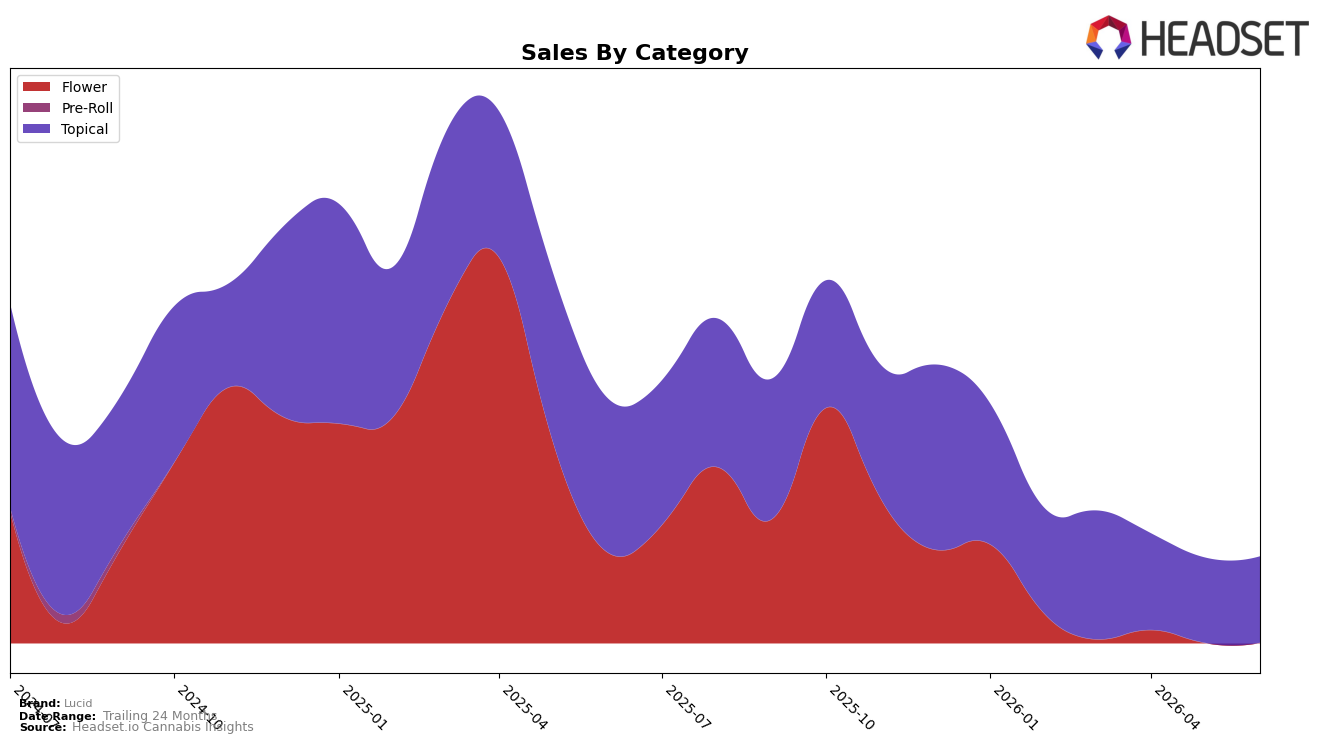
In June 2026, Lucid’s mix is fully concentrated in Topical, with 100.0% category share, while category sales declined 43.99% year over year and edged up 1.30% month over month. The brand’s average price fell 29.74% YoY to $14.90, alongside a brand-level sales decline of 64.68% YoY, indicating unit volumes did not offset pricing compression; the slight 1.30% MoM lift suggests stabilization rather than recovery. With no diversification beyond Topical and a 24-month sales drop of 87.02%, the pattern implies a narrow portfolio that magnifies category swings in Washington and limits cross-category buffering.
The shift toward a single-category footprint positions Lucid as a price-discounted Topical specialist rather than a balanced portfolio brand, because a 29.74% YoY price contraction paired with a 64.68% YoY sales decline concentrates risk where price sensitivity is highest. The 1.30% MoM sales uptick against a 100.0% Topical mix implies any near-term gains depend on incremental Topical demand rather than mix expansion, so restoration of rank in Washington Topicals will rely more on price architecture and pack-size strategy than on category spillover; the 87.02% 24-month sales contraction underscores that current positioning trades breadth for a narrow, potentially volatile niche.
Competitive Landscape
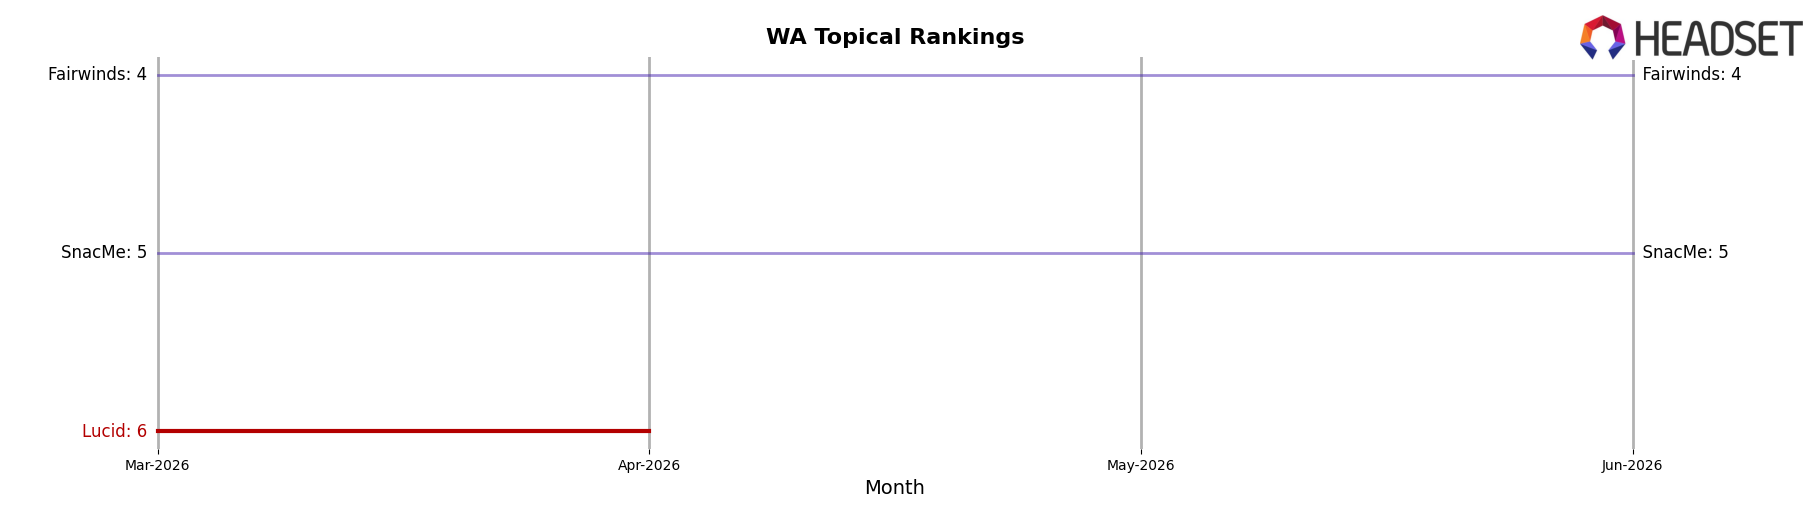
Lucid sits at rank #6 in WA Topical for June 2026, down 1 position from #5 year over year, and it has held #6 for three months while its peak of #5 came in September 2025; meanwhile, Ceres held #1 year over year with a -5.8% sales change, and Agro Couture climbed from #3 to #2 on +6.5% sales growth, indicating Lucid’s flat rank trend is losing relative momentum as upward movers compress the space above it. In the mid-tier, Double Delicious slipped from #2 to #3 with a -27.0% sales decline while SnacMe advanced from #6 to #5 on +54.5% sales growth, suggesting Lucid’s -1 rank change year over year and unchanged #6 since March 2026 position it at risk of further share erosion if adjacent brands keep posting double-digit swings.
Notable Products
Indica Infusions (500mg) posted the most abrupt move in June 2026 with a +96.9% month-over-month surge to rank 1, while Sativa Infusion (500mg) climbed +74.0% to rank 4. In contrast, Indica Infusions 2-Pack (1000mg) fell -68.1% to rank 5, creating a widening spread between single-unit formats at ranks 1 and 4 and the multi-pack at rank 5; this divergence implies format preference is consolidating around single SKUs rather than bundles.
Indica Infusions (1000mg) in rank 2 grew a modest +1.3% while Sativa Infusion (1000mg) in rank 3 advanced +23.3%, placing all four top positions with Topical products and concentrating the top ten in a single category. With three of the top four showing positive MoM and two exceeding +70% and +90% respectively, the mix implies Lucid’s near-term commercial direction is anchored in Topicals with emphasis on single-format potency tiers over multi-pack experiments.
Top Selling Cannabis Brands
Data for this report comes from real-time sales reporting by participating cannabis retailers via their point-of-sale systems, which are linked up with Headset’s business intelligence software. Headset’s data is very reliable, as it comes digitally direct from our partner retailers. However, the potential does exist for misreporting in the instance of duplicates, incorrectly classified products, inaccurate entry of products into point-of-sale systems, or even simple human error at the point of purchase. Thus, there is a slight margin of error to consider. Brands listed on this page are ranked in the top twenty within the market and product category by total retail sales volume.

