May-2026
Sales
Trend
6-Month
Product Count
SKUs
Avg Price
YoY Sales Change
YoY Price Change
Market Insights Snapshot
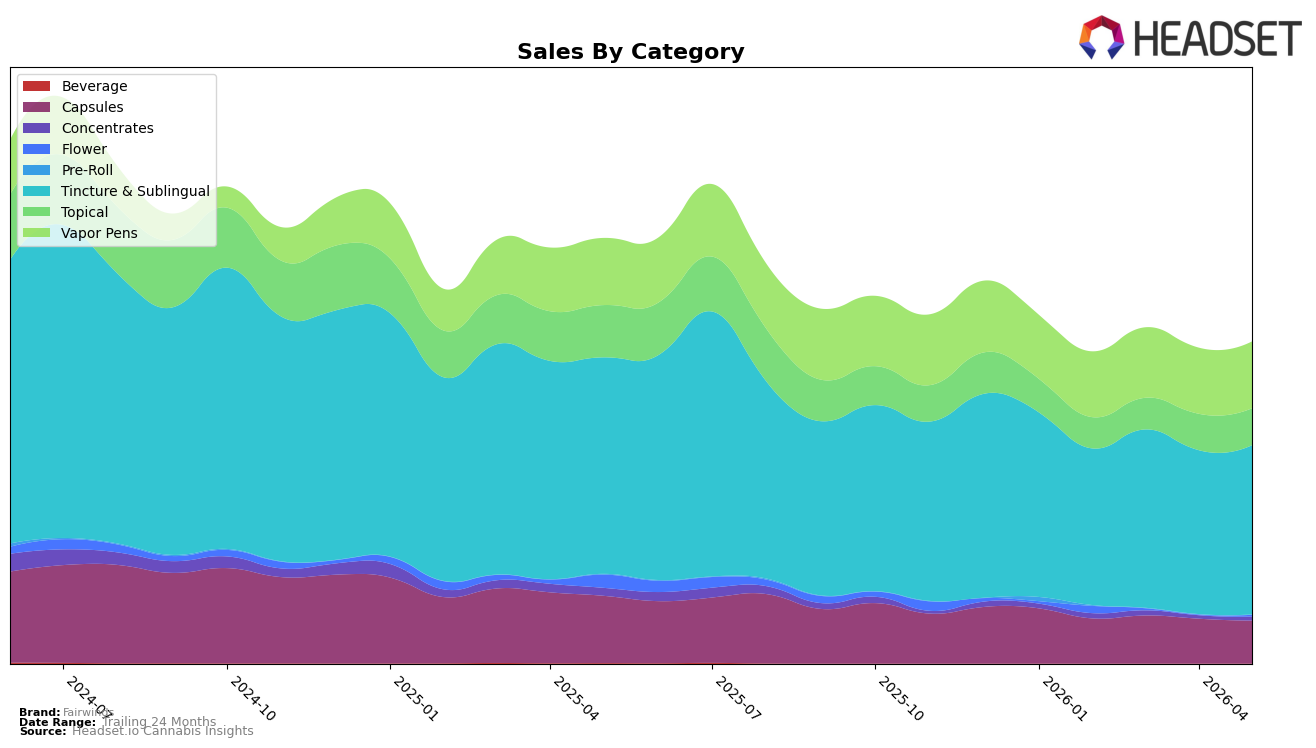
In May 2026, Fairwinds concentrated 52.76% of sales in Tincture & Sublingual, where category sales were down 21.89% year over year but up 3.23% month over month, while Vapor Pens held 20.80% share with a 0.44% YoY decline and 1.08% MoM lift. Capsules contracted to 13.34% share with a 36.29% YoY decline and a 4.37% MoM drop, and Topical represented 11.44% share with a 29.54% YoY decline alongside a 1.49% MoM gain. Edge categories were volatile: Concentrates held 1.18% share with a 50.75% YoY decline but an 18.44% MoM jump, and Flower at 0.46% share posted an 88.56% YoY decline but a 277.89% MoM spike. With an overall brand sales decline of 24.44% YoY and a slight 1.33% YoY rise in average price to $19.95, the mix indicates reliance on a declining core offset by small MoM recoveries and tactical experimentation at the perimeter.
These shifts imply Fairwinds is anchoring on Tincture & Sublingual, where a rank of 2 in Washington can buffer broader contraction, while minor MoM lifts in Vapor Pens (+1.08%) and Topical (+1.49%) provide incremental breadth without diluting the core. The sharp MoM surge in Flower (+277.89%) from a 0.46% share base and the 18.44% MoM rebound in Concentrates suggest targeted tests rather than scalable growth engines, especially given 88.56% and 50.75% YoY declines respectively. With Capsules down 36.29% YoY and losing 4.37% MoM share momentum, the portfolio’s near-term positioning favors defending the high-share Tincture & Sublingual franchise while using selective, low-base categories to probe for incremental distribution and price-pack architecture that can stabilize overall mix against a 24.44% YoY brand decline.
Competitive Landscape
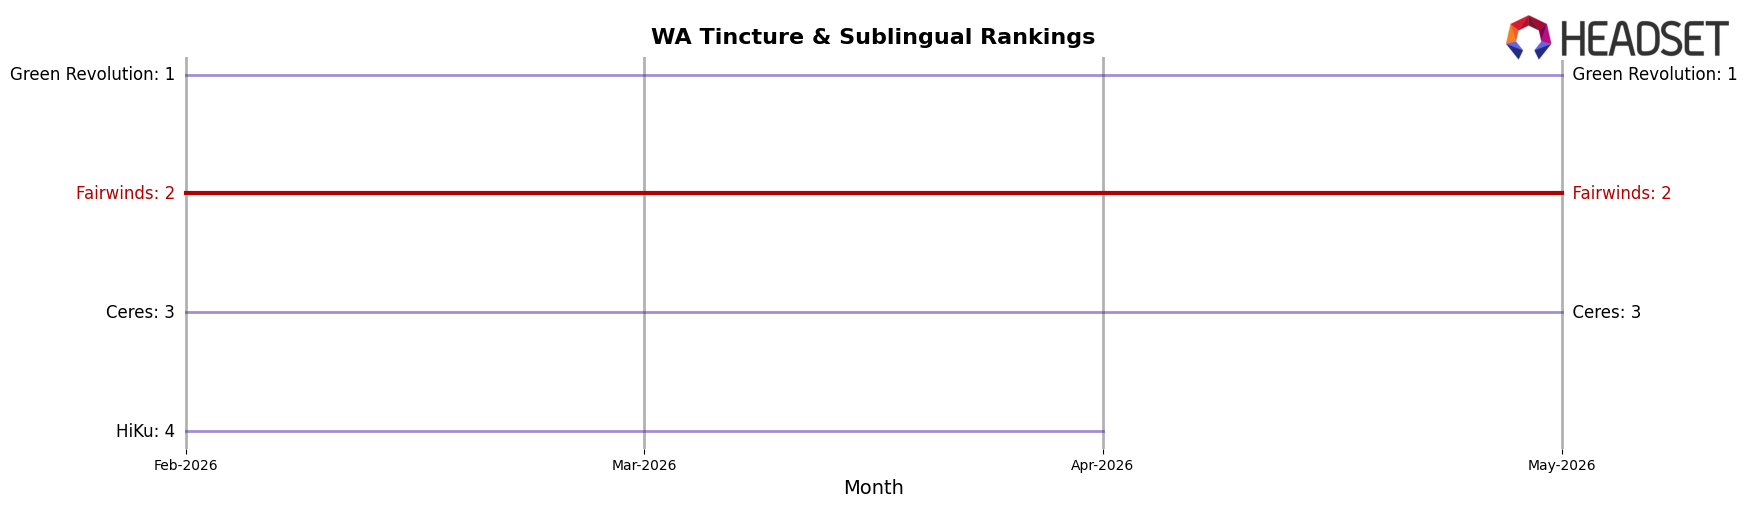
Fairwinds is ranked #2 in Washington Tincture & Sublingual for May 2026, down 1 position year over year from #1, with a stable #2 position since February 2026 and a prior peak at #1 in July 2025; meanwhile, Green Revolution holds #1 after moving up from #2 year over year while posting a -10.8% sales change, and Ceres sits at #3 with a -47.6% sales change as Canna Cantina grows 65.1% but remains at #5. The combination of Fairwinds’ slip from #1 to #2 and competitors’ divergent momentum—leader erosion at -10.8% and a fast-growing #5 at +65.1%—implies a tightening top tier where maintaining share will depend on defending against a rising lower-ranked challenger rather than merely closing the gap to the current #1.
Notable Products
The steepest decline came from CBD Sativa Lifestyle Tincture (100mg, 2oz), which fell 12.19% MoM to rank 10 while CBD/THC 1:1 Ratio Tincture (100mg CBD, 100mg THC, 0.26oz) dropped 11.33% to rank 6, even as CBD/THC 5:1 Companion Savory Bacon 64x Tincture (200mg CBD, 40mg THC, 8ml, 0.54 fl oz) rose 9.20% and held rank 1. Four of the top ten are Tincture & Sublingual SKUs, but the divergence between double-digit declines at ranks 6 and 10 and double-digit gains at ranks 1 and 3 suggests mix-shift within the same category. CBD/THC/CBG 1:1:1 Flow Cream Deep Tissue Relief (175mg CBD, 175mg THC, 175mg CBG, 1.1oz, 30g) advanced 16.38% at rank 7, outpacing the CBD/THC 20:1 Ratio Co2 Cartridge (1g) which slid 6.33% to rank 8, indicating non-inhalable relief formats are pulling share from inhalable options. This pattern implies Fairwinds is consolidating around functional high-ratio tinctures and topicals while legacy balanced or sativa-forward tinctures lose momentum, pointing product development and merchandising toward 5:1 companion formulas and multi-cannabinoid relief SKUs.
Top Selling Cannabis Brands
Data for this report comes from real-time sales reporting by participating cannabis retailers via their point-of-sale systems, which are linked up with Headset’s business intelligence software. Headset’s data is very reliable, as it comes digitally direct from our partner retailers. However, the potential does exist for misreporting in the instance of duplicates, incorrectly classified products, inaccurate entry of products into point-of-sale systems, or even simple human error at the point of purchase. Thus, there is a slight margin of error to consider. Brands listed on this page are ranked in the top twenty within the market and product category by total retail sales volume.

