.svg)

Sep-2026
Sales
Trend
6-Month
Product Count
SKUs
Avg Price
YoY Sales Change
YoY Price Change


Where to Buy
Luminous Botanicals is stocked at 11 licensed dispensaries across Oregon, with the deepest coverage in Portland, Gresham, Hillsboro, Hood River, and Oregon City. Search by ZIP code or city below to find the closest one, or filter by product type if you are after a specific format.
Market Insights Snapshot
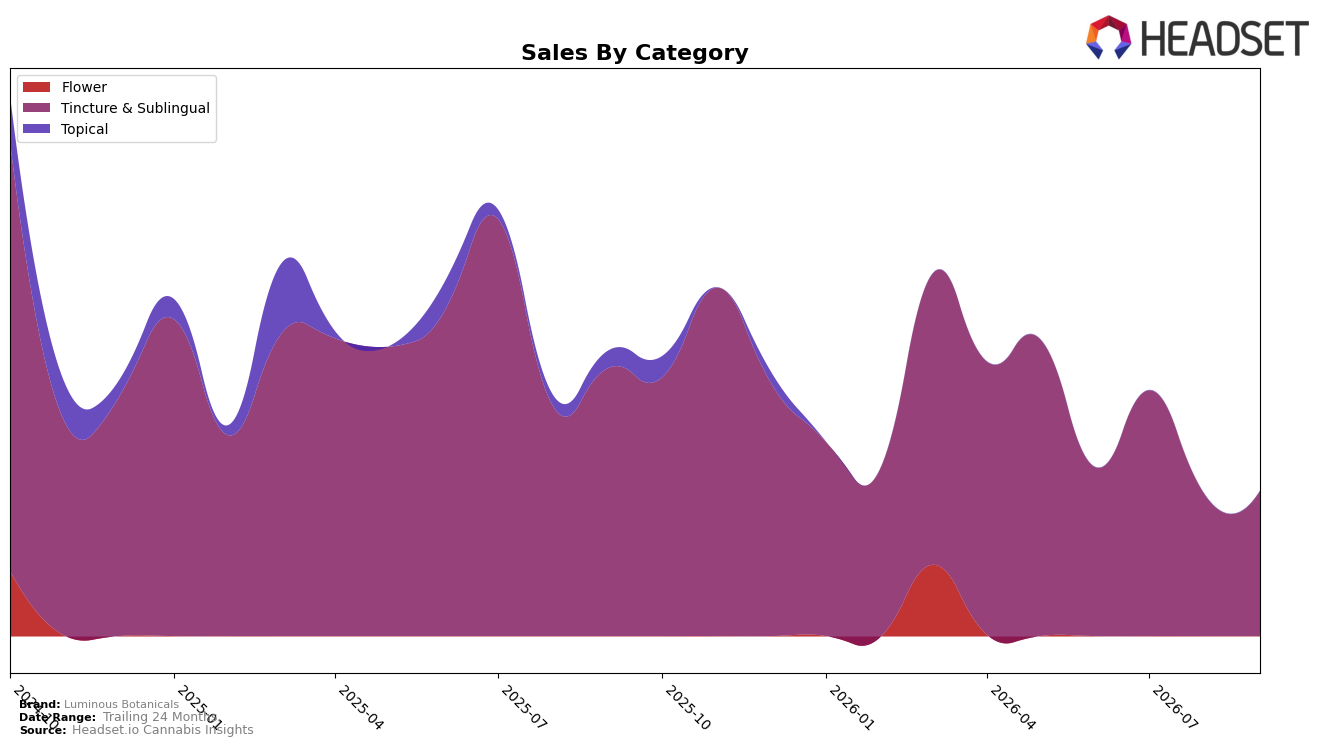
In September 2026, Luminous Botanicals operated as a single-category brand, with Tincture & Sublingual accounting for 100.0% of sales, up 2.49% month over month but down 45.87% year over year. Brand-level sales declined 49.13% year over year while average price fell 18.08%, indicating unit trends deteriorated faster than pricing alone would explain; the 2.49% month-over-month lift against a 100.0% mix concentration implies the near-term uptick came entirely from Tincture & Sublingual rather than diversification. The pattern suggests that reliance on one category produced amplified volatility: small monthly gains are unlikely to offset a multi-quarter contraction when the entire portfolio is tied to a single demand curve.
With the top market in Oregon and no reported rank within Tincture & Sublingual, the 100.0% mix concentration paired with a 45.87% year-over-year drop signals positioning risk as category momentum shifts and price compression compounds exposure. The 2.49% month-over-month increase at a $29.83 average price, set against a 49.13% brand sales decline year over year, implies that short-term promotions or mix within SKU tiers can lift volume temporarily but may be training demand toward lower price points; strategically, the brand’s positioning is trending toward price-sensitive segments within Tincture & Sublingual rather than breadth across adjacent form factors.
Competitive Landscape
Luminous Botanicals sits at rank #15 in Oregon Tincture & Sublingual for September 2026, slipping 3 spots year over year from #12 and down 1 place from June 2026’s #14, while its best position this year peaked at #11 in July 2026. Competitive pressure is intensifying at the top: Hapy Kitchen advanced from #3 to #2 with a 68.6% year-over-year sales increase, and Mule Extracts jumped from #11 to #5 alongside a 347.8% year-over-year surge, whereas category leader Angel (OR) held #1 despite a 13.9% year-over-year decline. The pattern implies that Luminous Botanicals’ downward rank drift amid faster-climbing rivals points to share compression unless the brand reclaims momentum from its July 2026 peak.

Notable Products
CBD/THC 1:1 Meadow Blend Tincture (189mg CBD, 180mg THC, 15ml, 0.5oz) posted the largest move in September 2026 with a +194.7% month-over-month surge and jumped into rank 1, while CBD/THC 9:1 Earth Blend Tincture (675mg CBD, 75mg THC, 1oz) fell -71.3% and sat at rank 2. The second 1:1 format, CBD/THC 1:1 Meadow Blend Tincture (375mg CBD, 375mg THC,30ml), also rose +112.4% and reached rank 2, and CBD:THC Sky Blend Tincture (75mg CBD, 675mg THC, 1oz, 30ml) held rank 3 with no month-over-month read. With both top slots occupied by 1:1 Meadow Blend SKUs and four of the top ten belonging to Tincture & Sublingual, the mix points to demand concentrating around balanced-ratio formats and smaller pack sizes, suggesting portfolio emphasis is shifting toward fast-turn, balanced tinctures over high-THC or high-CBD extremes.
Top Selling Cannabis Brands






Data for this report comes from real-time sales reporting by participating cannabis retailers via their point-of-sale systems, which are linked up with Headset’s business intelligence software. Headset’s data is very reliable, as it comes digitally direct from our partner retailers. However, the potential does exist for misreporting in the instance of duplicates, incorrectly classified products, inaccurate entry of products into point-of-sale systems, or even simple human error at the point of purchase. Thus, there is a slight margin of error to consider. Brands listed on this page are ranked in the top twenty within the market and product category by total retail sales volume.

