Jun-2026
Sales
Trend
6-Month
Product Count
SKUs
Avg Price
YoY Sales Change
YoY Price Change
Market Insights Snapshot
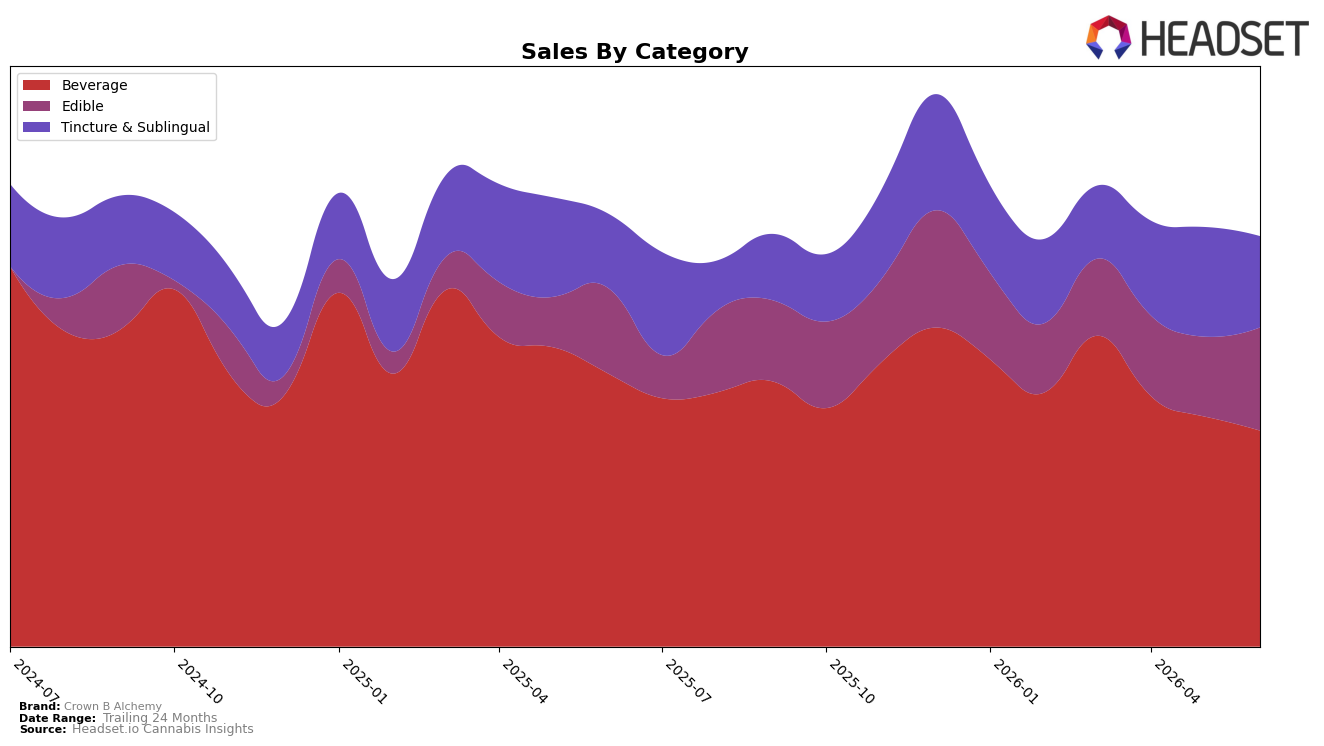
In June 2026, Crown B Alchemy’s mix tilted away from Beverage as Beverage fell 20.91% year over year and 6.11% month over month to 52.67% share, while Edible expanded 20.78% YoY and 29.26% MoM to 25.11% share, and Tincture & Sublingual rose 22.78% YoY but slid 16.77% MoM to 22.22% share. Despite an overall brand sales decline of 5.20% YoY and an average price dip of 2.06%, the category reshuffle indicates demand is consolidating into lower-price Edibles (average price $8.73) at the expense of higher-price Beverage, implying immediate mix pressure but a near-term volume hedge.
The shift toward Edible (+29.26% MoM) alongside a Beverage contraction (−6.11% MoM) suggests Crown B Alchemy is migrating from a premium-price reliance (Beverage at $34.50, Tincture & Sublingual at $36.33) toward value-access points, which can stabilize unit throughput but compress revenue per unit. Holding a 52.67% share in Beverage while ranking 5th in Oregon Beverage frames a positioning choice: lean into differentiated Beverage to defend rank or accelerate Edible expansion to capture trading-down behavior, with the pattern implying a barbell strategy to protect rank while harvesting Edible-led volume.
Competitive Landscape
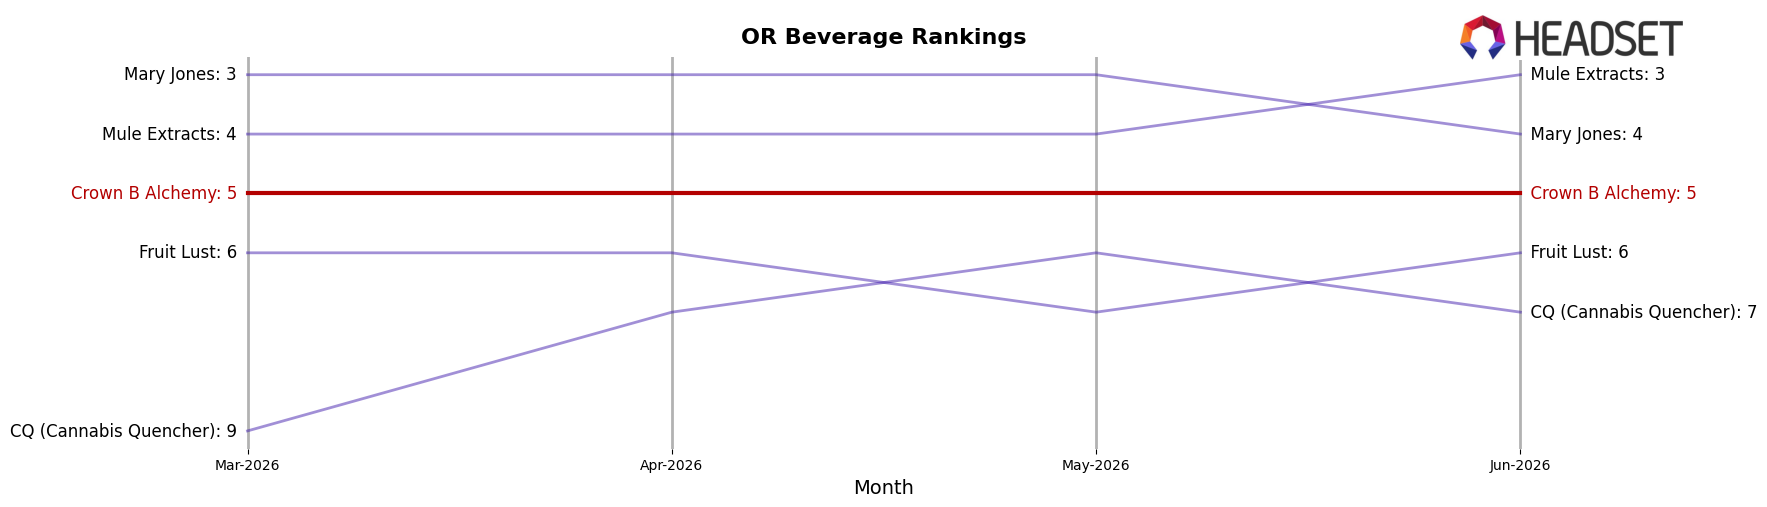
Crown B Alchemy is ranked #5 in OR Beverage in June 2026, down 1 position year over year from #4, and unchanged versus March 2026 at #5; against that backdrop, Magic Number held #1 year over year and in June 2026 while growing sales 14.2%, and Mary Jones climbed from #5 to #4 on 58.1% sales growth, indicating upward pressure directly above Crown B Alchemy. With a peak at #3 in July 2024 and a current #5 rank persisting for three months, the pattern implies Crown B Alchemy is stabilizing below the leaders while losing relative position to faster-rising neighbors, signaling that without a share-accretive move it is more likely to drift laterally than return to its prior peak.
Notable Products
CBD/THC 1:1 Peach Mango Gummies 2-Pack (100mg CBG 100mg THC) posted the standout move in June 2026 with an 87.9% month-over-month gain and a rise to rank 6, while Cannabull - Mango Nano Syrup (1000mg THC, 4oz) fell 16.8% MoM to rank 8. CBD/THC/CBG 1:1:1 Moonlight Serenade Gummies 2-Pack (100mg CBD, 100mg THC, 100mg CBN) grew 35.2% MoM to hold rank 1, and Green Apple Gummies 2-Pack (100mg) advanced 25.7% MoM at rank 2, signaling momentum concentrated at the very top. Four of the top ten are Edible SKUs clustered at ranks 1–6 with MoM changes of +35.2%, +25.7%, +16.8%, and +20.9%, whereas Beverage positions at ranks 7–10 include one decline of -16.8% and two entries without MoM history, implying category stability is tilting toward Edibles even as legacy Beverage syrups still contribute $15,176 in June 2026. The pattern suggests Crown B Alchemy’s commercial direction is pivoting toward multi-cannabinoid Edible formats that can scale share quickly while Beverage reliance is thinning to fewer, higher-ticket items.
Top Selling Cannabis Brands
Data for this report comes from real-time sales reporting by participating cannabis retailers via their point-of-sale systems, which are linked up with Headset’s business intelligence software. Headset’s data is very reliable, as it comes digitally direct from our partner retailers. However, the potential does exist for misreporting in the instance of duplicates, incorrectly classified products, inaccurate entry of products into point-of-sale systems, or even simple human error at the point of purchase. Thus, there is a slight margin of error to consider. Brands listed on this page are ranked in the top twenty within the market and product category by total retail sales volume.

