Jun-2026
Sales
Trend
6-Month
Product Count
SKUs
Avg Price
YoY Sales Change
YoY Price Change
Market Insights Snapshot
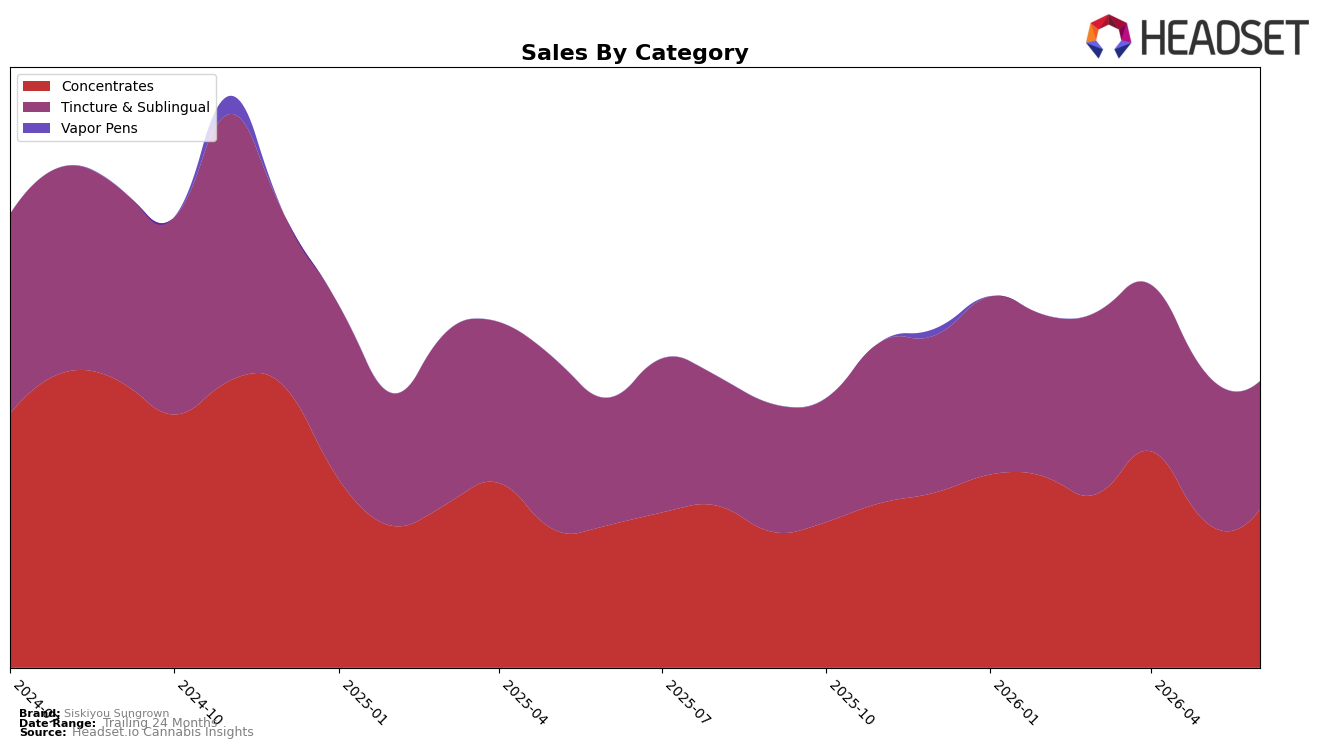
Siskiyou Sungrown concentrated revenue into two categories in June 2026, with Concentrates at 55.23% share and Tincture & Sublingual at 44.77%, while total brand sales were up 6.15% year over year and average price fell 2.15%. Within the mix, Concentrates advanced 11.07% YoY and 7.81% MoM alongside an average price of $22.36, whereas Tincture & Sublingual edged up 0.66% YoY but contracted 14.04% MoM with an average price of $24.87. Given a Concentrates rank of 45 in Oregon and category share tilting toward Concentrates, the pattern implies the brand is leaning into higher-velocity Concentrates to offset month-on-month pressure in Tincture & Sublingual and stabilize growth at the current price mix.
The faster MoM growth in Concentrates at 7.81% versus a 14.04% MoM decline in Tincture & Sublingual, paired with a 11.07% vs. 0.66% YoY split, suggests near-term positioning should center on Concentrates where current ranking at 45 signals room to climb with incremental distribution and pricing discipline. With a 55.23% share anchored in Concentrates and a brand-level 24-month sales change of -28.10% contrasting with the current 6.15% YoY uptick, the thesis is that doubling down on Concentrates while selectively pruning lower-yield Tincture & Sublingual SKUs can convert the recent month-on-month momentum into durable share gains in Oregon.
Competitive Landscape
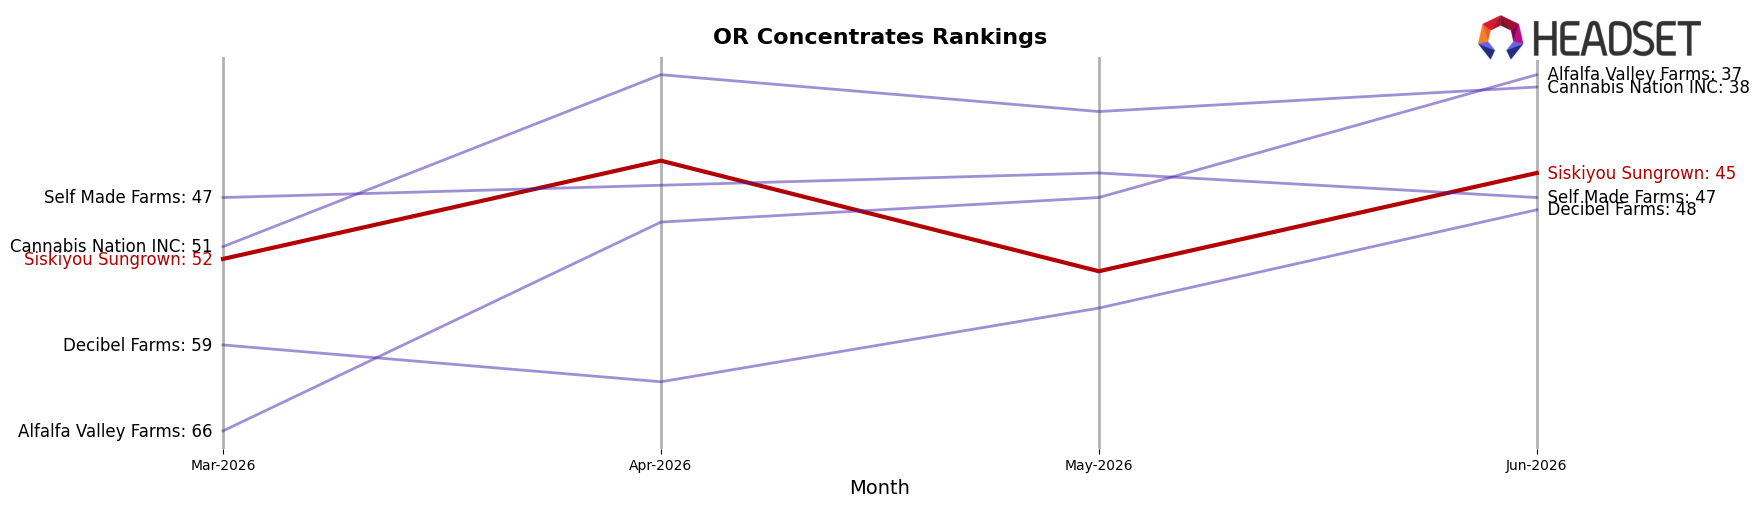
Siskiyou Sungrown sits at rank #45 in OR Concentrates for June 2026, improving 5 positions from #50 year over year and 7 positions from #52 three months ago, while still trailing its peak at #32 from November 2024; in contrast, Oregrown moved up from #3 to #2 with 153.42% YoY sales growth and Buddies advanced from #8 to #4 alongside 77.09% YoY growth, indicating Siskiyou Sungrown’s gradual rank gains are outpaced by faster-climbing leaders and imply a need to accelerate velocity or assortment shifts to convert incremental progress into a sustained top-40 reentry.
Notable Products
CBD/THC 1:1 Full Spectrum RSO (1g) posted the largest month-over-month gain at 61.4% to reach rank 1, while THC Cannabis Oil RSO (1g) fell 28.3% to rank 4, marking a split within Concentrates where ranks 1, 2, 4, 8, and 10 are RSO formats. With THC RSO (1g) up 41.1% at rank 2 and CBD/THC 1:1 Full Extract Cannabis Oil (1g) rising 8.0% at rank 10, the category tilt points to RSOs regaining shopper attention even as CBD RSO Dripper (1g) dropped 29.6% to rank 8. In contrast, Tincture & Sublingual skus concentrated at ranks 3, 5, 6, 7, and 9 saw mixed performance, from -39.7% for CBD/THC 1:1 Alcohol Tincture (350mg CBD, 350mg THC, 1.08oz, 32ml) at rank 7 to +28.0% for MCT Mint Flavor Tincture (700mg, 1.08oz) at rank 5, and the CBD/THC 1:1 MCT Peppermint Tincture (350mg CBD, 350mg THC) slid 13.7% at rank 3. The pattern implies Siskiyou Sungrown is pivoting toward higher-velocity RSO Concentrates while paring back reliance on mixed-CBD tinctures that are dropping in rank and momentum.
Top Selling Cannabis Brands
Data for this report comes from real-time sales reporting by participating cannabis retailers via their point-of-sale systems, which are linked up with Headset’s business intelligence software. Headset’s data is very reliable, as it comes digitally direct from our partner retailers. However, the potential does exist for misreporting in the instance of duplicates, incorrectly classified products, inaccurate entry of products into point-of-sale systems, or even simple human error at the point of purchase. Thus, there is a slight margin of error to consider. Brands listed on this page are ranked in the top twenty within the market and product category by total retail sales volume.

