Jun-2026
Sales
Trend
6-Month
Product Count
SKUs
Avg Price
YoY Sales Change
YoY Price Change
Market Insights Snapshot
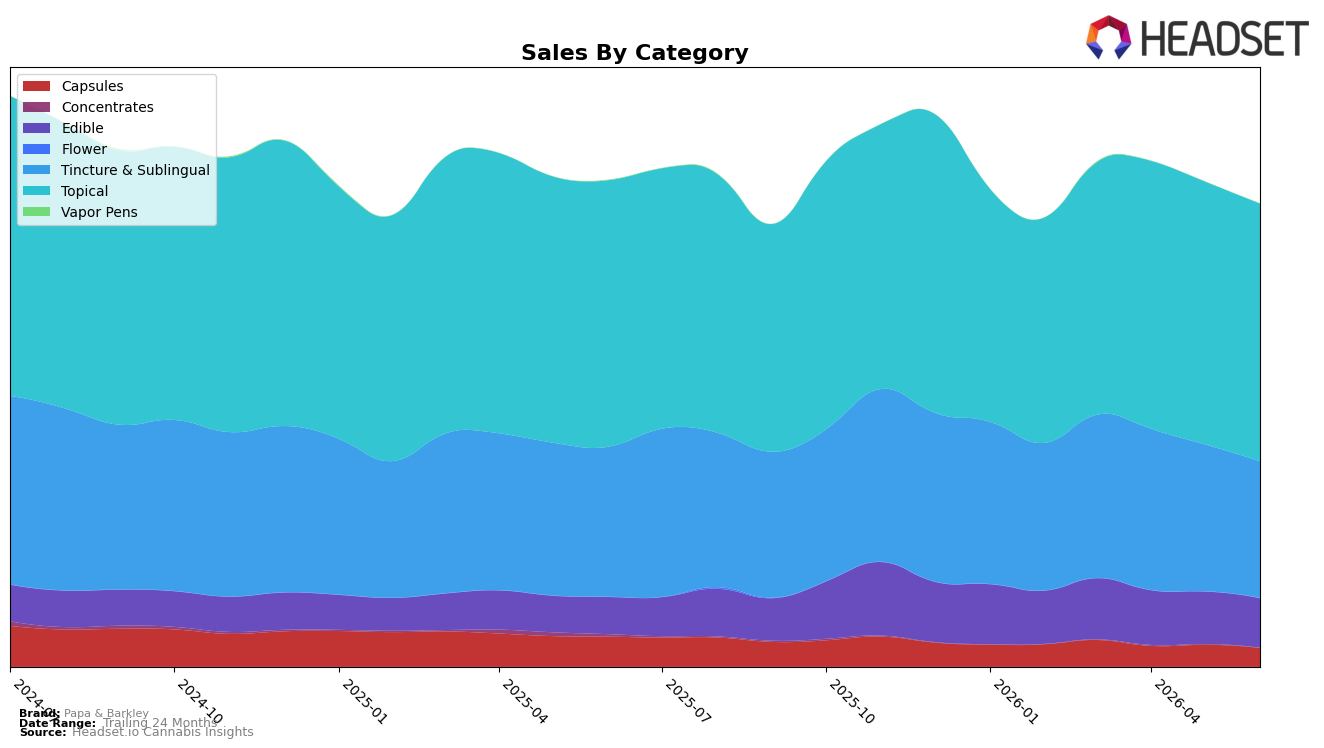
Papa & Barkley concentrated 55.77% of June 2026 sales in Topical, where year-over-year declined 3.29% and month-over-month slipped 1.97%, while Tincture & Sublingual held 29.54% share with steeper contractions of 8.91% YoY and 7.04% MoM. Edible reached 10.65% share on a 33.36% YoY increase despite a 5.77% MoM dip, and Capsules compressed to 4.03% share with a 37.89% YoY drop and 14.59% MoM decline. With brand-level sales down 4.87% YoY and average price down 6.51%, the mix tilts toward a stable lead category and a faster-growing but smaller Edible line, implying a gradual shift from higher-priced sublinguals to lower-priced, velocity-oriented formats.
Holding rank 1 in Topical in California even as that category fell 1.97% MoM and 3.29% YoY suggests defensible authority that can offset volatility in Tincture & Sublingual, which contracted 7.04% MoM and 8.91% YoY. The 33.36% YoY rise in Edible alongside a 5.77% MoM pullback and a 6.51% brand-wide price decrease points to price-sensitive trial that can be converted into repeat if portfolio pricing ladders are managed; combined with a 37.89% YoY and 14.59% MoM slide in Capsules, the signal is to anchor positioning around pain-relief and wellness topicals while selectively expanding approachable Edible formats to recapture sublingual attrition.
Competitive Landscape
Papa & Barkley holds rank #1 in California Topical in June 2026, unchanged from #1 a year ago, and steady at #1 since March 2026, while Mary's Medicinals sits at #2 with a year-over-year decline from #2 paired with a -26.7% sales change, and Buddies remains at #3 despite a +64.5% year-over-year sales increase. Further down, Liquid Flower improved rank from #6 to #4 with +58.7% sales growth, while Carter's Aromatherapy Designs (C.A.D.) slid from #4 to #5 alongside a -22.2% sales change; despite these shifts, Papa & Barkley’s unbroken #1 from April 2026 through June 2026 implies entrenched category leadership that competitors with faster growth rates have not yet converted into rank displacement.

Notable Products
The steepest decline came from CBD/THC 1:3 THC Rich Releaf Body Oil (100mg CBD, 300mg THC, 60ml), down 13.3% month over month and sitting at rank 6, while the category leader Sleep Releaf- CBD/CBN/THC 1:1:1 Berry Pomegranate Solventless Gummies 20-Pack (100mg CBN, 100mg CBD, 100mg THC) slid 5.2% at rank 1. Topicals dominate with six of the top ten, but mixed signals within the family are clear: CBD/THC 3:1 CBD Rich Releaf Balm (450mg CBD, 150mg THC, 50ml 1.7oz) fell 8.5% at rank 4 as the smaller 3:1 Balm (90mg CBD, 30mg THC, 15ml, 0.5oz) was essentially flat at rank 8. Tinctures softened as THC Releaf Oil Tincture (1000mg THC, 15ml) dropped 6.8% at rank 7 and CBD/THC 30:1 CBD Rich Releaf Tincture (435mg CBD, 15mg THC, 15ml) eased 2.9% at rank 9, indicating customers are prioritizing topical relief over sublinguals despite the gummies’ hold on the top spot. The product mix implies Papa & Barkley is leaning into pain- and sleep-oriented formats with breadth in Topicals and a single edible anchor, favoring depth in therapeutic ratios over new form-factor expansion.
Top Selling Cannabis Brands
Data for this report comes from real-time sales reporting by participating cannabis retailers via their point-of-sale systems, which are linked up with Headset’s business intelligence software. Headset’s data is very reliable, as it comes digitally direct from our partner retailers. However, the potential does exist for misreporting in the instance of duplicates, incorrectly classified products, inaccurate entry of products into point-of-sale systems, or even simple human error at the point of purchase. Thus, there is a slight margin of error to consider. Brands listed on this page are ranked in the top twenty within the market and product category by total retail sales volume.

