Jun-2026
Sales
Trend
6-Month
Product Count
SKUs
Avg Price
YoY Sales Change
YoY Price Change
Market Insights Snapshot
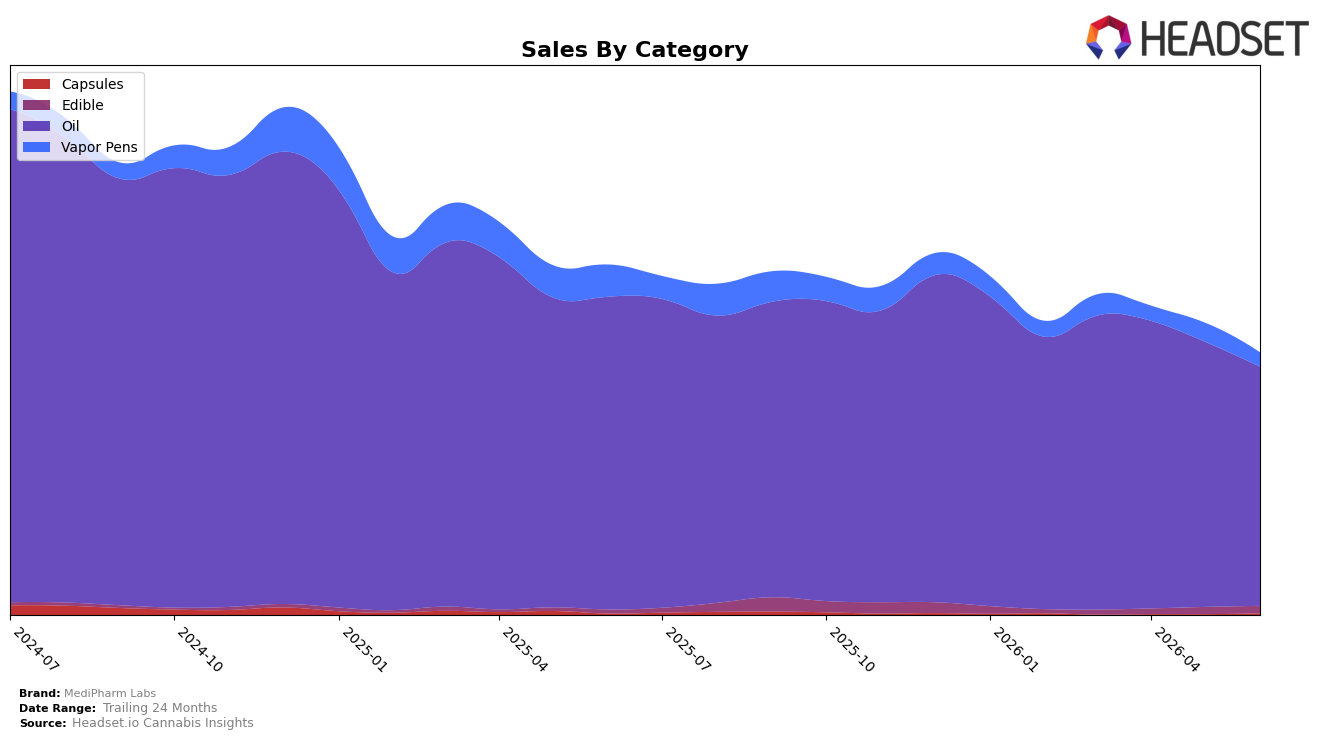
In June 2026, MediPharm Labs concentrated 90.67% of sales in Oil, where year-over-year declined 23.48% and month-over-month fell 9.85%, while Vapor Pens at 5.57% share contracted faster with a 54.84% YoY drop and a 24.04% MoM slide. Smaller lines provided counterweight: Edible at 2.97% share expanded 77.23% YoY and 3.65% MoM, and Capsules at 0.79% share rose 8.54% YoY with a 60.70% MoM jump. With average price down 3.97% YoY to $42.25 and total brand sales down 24.94% YoY, the mix indicates dependence on a shrinking Oil base while emergent categories are growing too small to offset near-term declines; the thesis is that risk is concentrated in Oil exposure and recovery hinges on accelerating the sub-5% share growth pockets.
The category shifts imply a positioning pivot opportunity: holding the number 1 rank in Oil in Alberta signals current leadership leverage, yet a 23.48% YoY and 9.85% MoM contraction in Oil suggests that relying on rank alone will not stabilize share. The contrasting growth in Edible at 77.23% YoY and Capsules at 60.70% MoM, alongside a 24.04% MoM decline in Vapor Pens, points to reallocating effort toward formats with traction while protecting Oil’s price-to-volume tradeoff after a 3.97% YoY price decrease; the thesis is that maintaining Oil leadership while scaling Edible and Capsules can diversify revenue and reduce volatility if mix lifts non-Oil share by several percentage points.
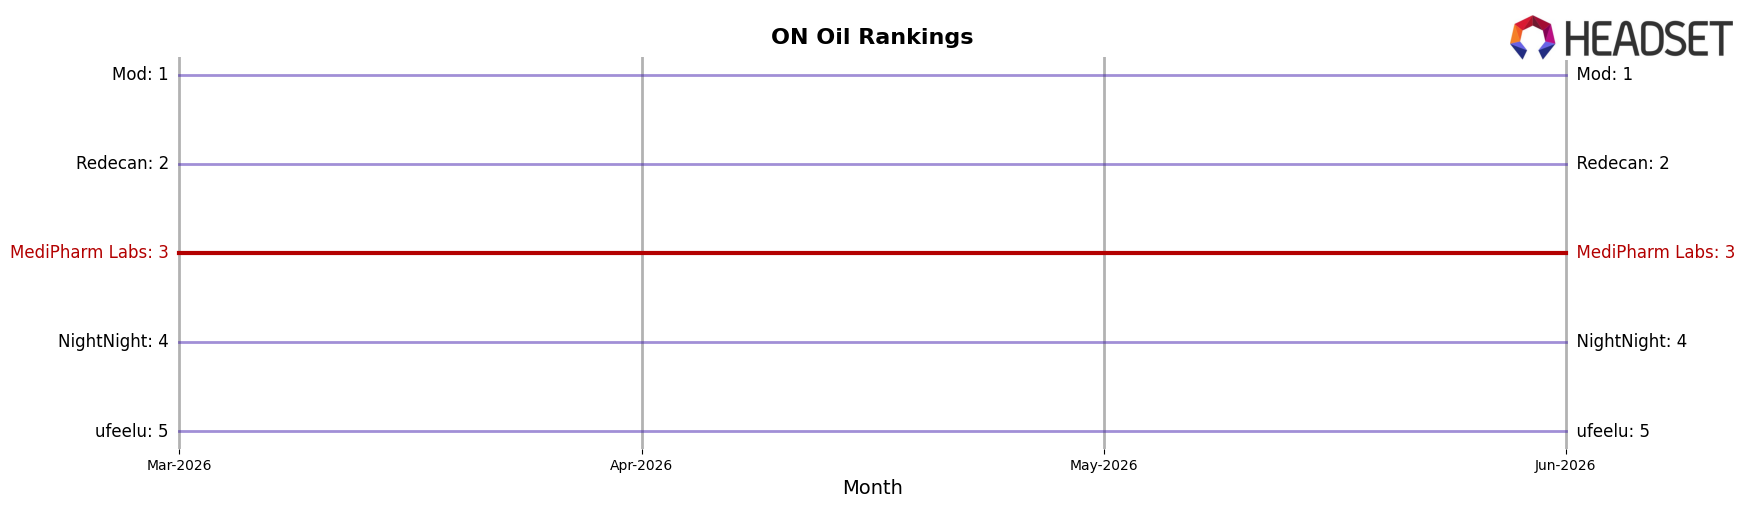
Competitive Landscape
MediPharm Labs sits at rank #3 in ON Oil for June 2026, unchanged from #3 year over year, and also steady versus three months ago at #3, while its peak was #2 back in December 2024; in contrast, Mod moved up from #2 to #1 with a 5.45% YoY sales lift and Redecan slipped from #1 to #2 amid a 29.23% YoY sales decline, positioning MediPharm Labs as stable but not ascending as peers reshuffle above and around it. The combination of a flat YoY rank at #3 and no change across the last three months at #3, alongside a competitor advance into #1 and another competitor’s drop to #2, implies MediPharm Labs is holding share but needs a catalyst to convert prior peak momentum from #2 in December 2024 into upward movement.
Notable Products
THC 30 Regular Formula Oil (30ml) led the downside in June 2026 with a -23.8% month-over-month drop while slipping to rank 1, and CBN:THC 1:2 Nighttime Formula Oil (30ml) also contracted -9.9% at rank 2; with five of the top ten coming from Oil, the category concentration amplified the pullback at the top of the list. Against that, CBD:THC 25:1 Ultra Formula Oil ( 3000mg CBD, 120mg THC ,30ml) surged +38.8% to rank 7, and THC Dissolving Drops Oil (30ml) gained +22.7% at rank 4, signaling selective demand for specialized formulations despite broad Oil softness. The $142,486 posted by CBN:THC 1:2 Nighttime Formula Oil (30ml) did not offset the Oil declines of -23.5% for THC 30 Plus Olive Oil Formula (30ml) at rank 9 and -19.1% for High CBD Distillate Disposable (1g) at rank 6, indicating pressure on both high-THC Oil and non-Oil extensions. The pattern implies MediPharm Labs is tilting toward niche, ratio-driven oils while legacy high-THC formats and peripheral devices cede share, pointing to a portfolio that benefits from reformulation and fewer broad-spectrum SKUs.
Top Selling Cannabis Brands
Data for this report comes from real-time sales reporting by participating cannabis retailers via their point-of-sale systems, which are linked up with Headset’s business intelligence software. Headset’s data is very reliable, as it comes digitally direct from our partner retailers. However, the potential does exist for misreporting in the instance of duplicates, incorrectly classified products, inaccurate entry of products into point-of-sale systems, or even simple human error at the point of purchase. Thus, there is a slight margin of error to consider. Brands listed on this page are ranked in the top twenty within the market and product category by total retail sales volume.

