Jun-2026
Sales
Trend
6-Month
Product Count
SKUs
Avg Price
YoY Sales Change
YoY Price Change
Market Insights Snapshot
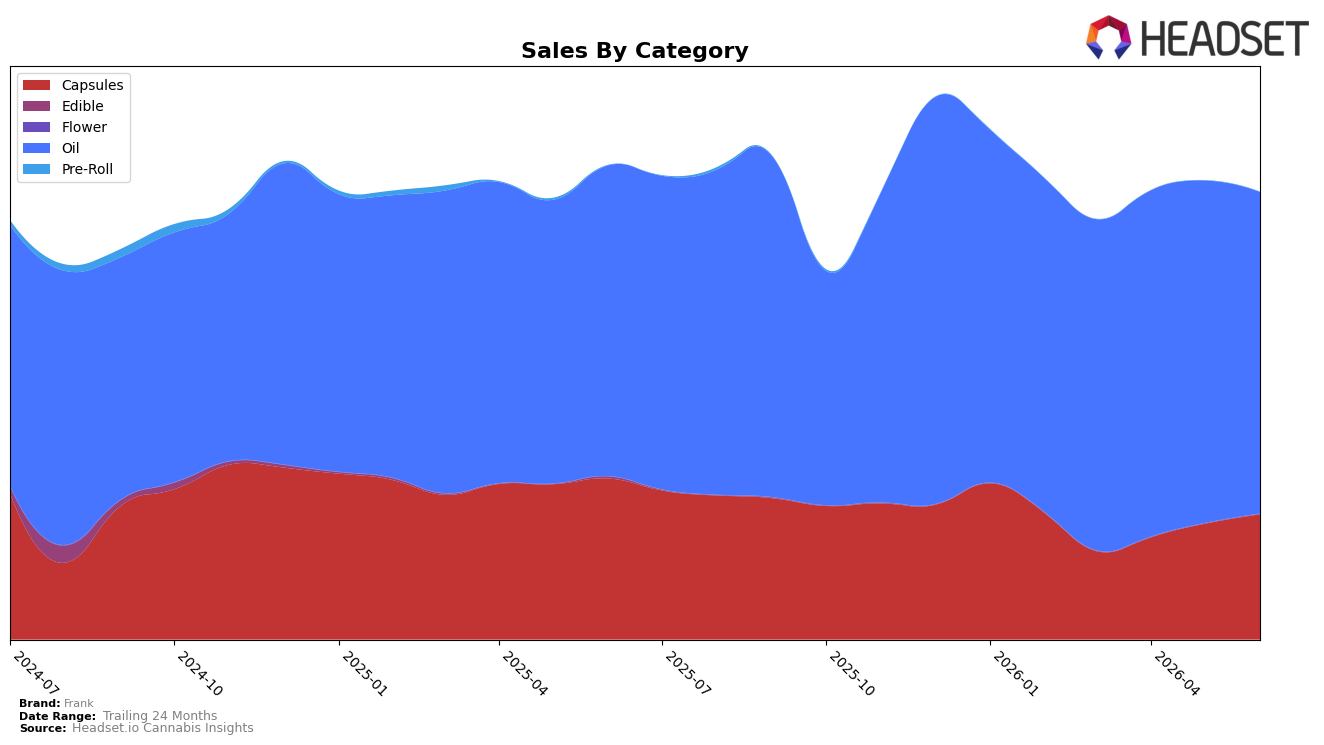
Frank’s category mix in June 2026 leaned heavily into Oil at 72.03% share, with Capsules at 27.97%, and the split carried contrasting momentum: Oil was up 3.53% year over year while down 6.08% month over month, whereas Capsules fell 22.35% year over year but rose 8.07% month over month. Against a brand-level sales decline of 5.67% year over year and a 3.31% average price increase, Oil’s higher average price of $31.49 versus Capsules at $23.23 suggests mix and price are pulling in different directions; the net pattern implies Frank is relying on Oil for stability while Capsules volatility is starting to rebalance near-term mix.
Positioning-wise, a 72.03% dependence on Oil combined with a rank of 5 in Oil in Alberta indicates concentration in a single category where Frank remains competitive but exposed to monthly softness, while the 8.07% month-over-month lift in Capsules from a smaller 27.97% base offers a hedge against Oil’s 6.08% month-over-month dip. The juxtaposition of Oil’s 3.53% year-over-year growth with Capsules’ 22.35% year-over-year decline implies Frank’s near-term differentiation is anchored in Oil value tiers while Capsules must either trade up or shrink, pointing to a portfolio that benefits from targeted Capsule recovery to reduce reliance on one category without diluting the Oil position at rank 5.
Competitive Landscape
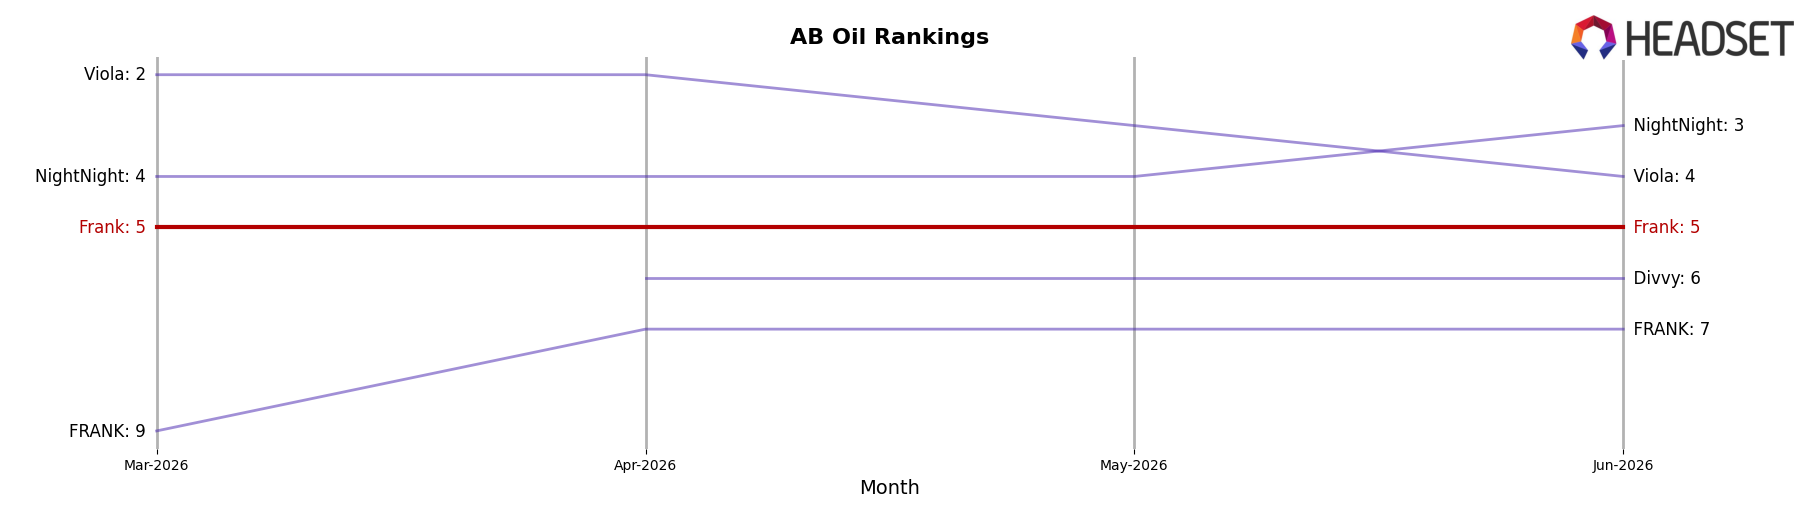
Frank sits at #5 in Oil in AB in June 2026, unchanged from #5 year over year, and flat versus three months ago at #5, while its peak at #2 in August 2024 marks a two-rank slide since that high; in contrast, MediPharm Labs held #1 year over year but with a -39.45% sales YoY, and NightNight climbed from #6 to #3 with +22.97% sales YoY, indicating that Frank’s static rank amid a top-tier competitor contraction and a mid-pack accelerator suggests share is being defended but not expanded as momentum concentrates above and below.
Notable Products
CBD 100 Oil (30ml) led June 2026 by rank 1 but declined 6.1% month over month while CBD Capsules 30-Pack (1500mg CBD) at rank 2 grew 8.1%, indicating a rotation toward formats beyond oil. With two of the top two SKUs split between Oil and Capsules, the category mix is diversifying even as the lead oil SKU generated $184,740 amid its 6.1% drop. The pattern implies Frank is shifting from a single-SKU oil reliance toward a more balanced portfolio where Capsules absorb momentum and cushion minor softness in Oil.
Top Selling Cannabis Brands
Data for this report comes from real-time sales reporting by participating cannabis retailers via their point-of-sale systems, which are linked up with Headset’s business intelligence software. Headset’s data is very reliable, as it comes digitally direct from our partner retailers. However, the potential does exist for misreporting in the instance of duplicates, incorrectly classified products, inaccurate entry of products into point-of-sale systems, or even simple human error at the point of purchase. Thus, there is a slight margin of error to consider. Brands listed on this page are ranked in the top twenty within the market and product category by total retail sales volume.

