Jun-2026
Sales
Trend
6-Month
Product Count
SKUs
Avg Price
YoY Sales Change
YoY Price Change
Market Insights Snapshot
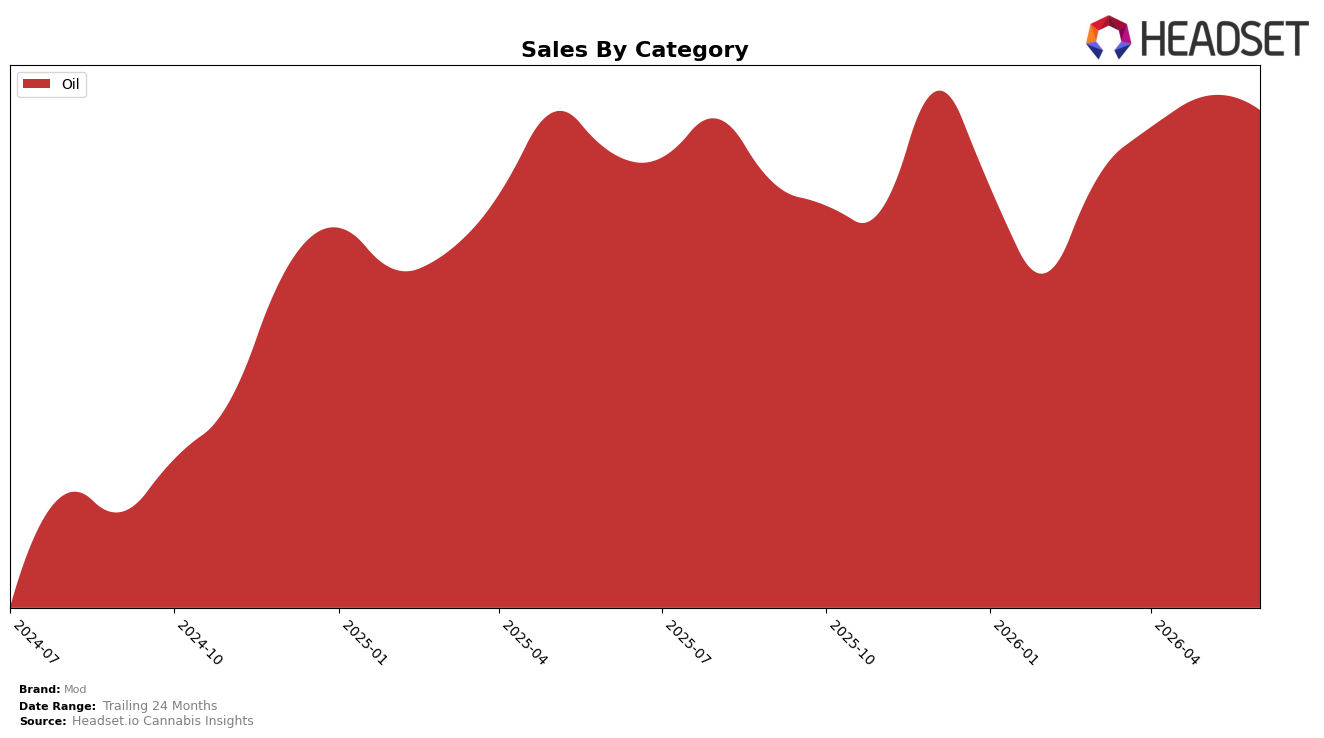
In June 2026, Mod’s category mix was fully concentrated in Oil at 100.0% share, with Oil sales up 5.45% year over year but down 1.72% month over month, while average price climbed 19.78% YoY to $36.59. The combination of a 100.0% single-category concentration and a No. 1 rank in Oil in Ontario indicates a focused bet on one format and a price-led YoY lift despite a short-term MoM pullback, implying limited diversification buffer if Oil volatility persists.
The 5.45% YoY growth against a 1.72% MoM decline, paired with a 19.78% YoY price increase at a 100.0% Oil mix, implies that Mod’s positioning hinges on premium pricing power rather than breadth of portfolio. Holding the No. 1 Oil rank in Ontario while relying entirely on Oil suggests headroom to defend share through pricing and pack architecture, but it also signals exposure: any sustained MoM softness in Oil would translate directly to brand-level deceleration without cross-category offsets.
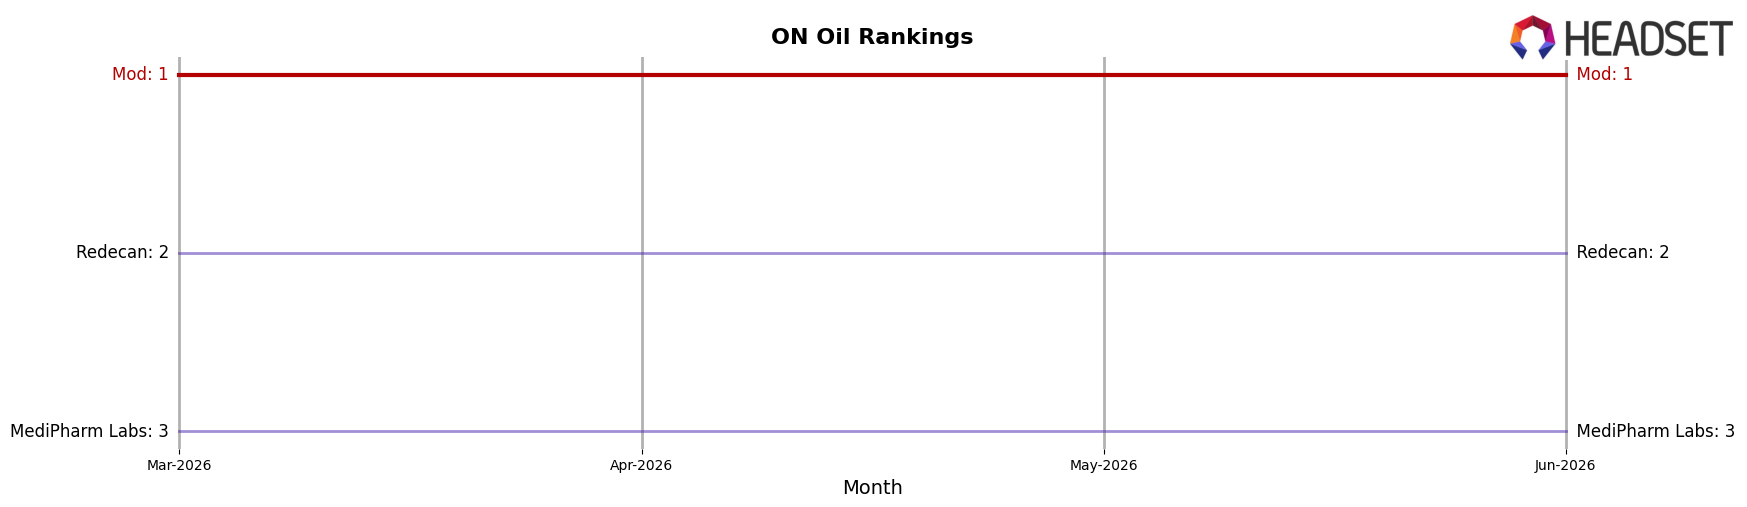
Competitive Landscape
Mod sits at rank #1 in ON Oil in June 2026 after climbing 1 position year over year from #2, and it has held #1 for the past 3 months with a peak at #1 in June 2026; in contrast, Redecan fell from #1 to #2 while its year-over-year sales declined 29.23%, and MediPharm Labs remained at #3 with a 3.03% sales dip YoY, indicating Mod’s rank gains coincide with share being ceded by incumbents rather than broad category expansion; furthermore, rising challengers like NightNight holding #4 with 20.26% YoY growth and ufeelu moving from #6 to #5 with 39.37% YoY growth show momentum lower in the table even as ranks #1–#3 are relatively static, implying Mod’s current #1 trajectory depends on defending against faster-growing mid-pack brands while capitalizing on competitors’ contractions at the top.
Notable Products
THC 1000 Oil Drops 10-pack (30ml) posted the standout move in June 2026 with +161.5% month over month, vaulting to rank 1 while THC 300 Oil Drops (9ml) fell -17.1% to rank 3. THC Variety Pack Oil Drops 4-Pack (12ml) climbed +54.9% to rank 2, but three minor-cannabinoid SKUs each contracted more than -21% as CBG/THC 300 Oil Drops (9ml) and CBN/THC 300 Oil Drops (9ml) dropped -21.6% and -21.1% to ranks 6 and 7, respectively. Eight of the top ten are Oil SKUs, and the steep retrenchment in THC/CBD Oil Drops (3ml) at -76.4% to rank 8 alongside a -58.1% slide for CBN/CBD 300 Oil Drops (9ml) to rank 9 contrasts with a single-product dollar anchor at $357,638, implying a pivot toward high-THC simplicity over blended formulations.
Top Selling Cannabis Brands
Data for this report comes from real-time sales reporting by participating cannabis retailers via their point-of-sale systems, which are linked up with Headset’s business intelligence software. Headset’s data is very reliable, as it comes digitally direct from our partner retailers. However, the potential does exist for misreporting in the instance of duplicates, incorrectly classified products, inaccurate entry of products into point-of-sale systems, or even simple human error at the point of purchase. Thus, there is a slight margin of error to consider. Brands listed on this page are ranked in the top twenty within the market and product category by total retail sales volume.

