Jun-2026
Sales
Trend
6-Month
Product Count
SKUs
Avg Price
YoY Sales Change
YoY Price Change
Market Insights Snapshot
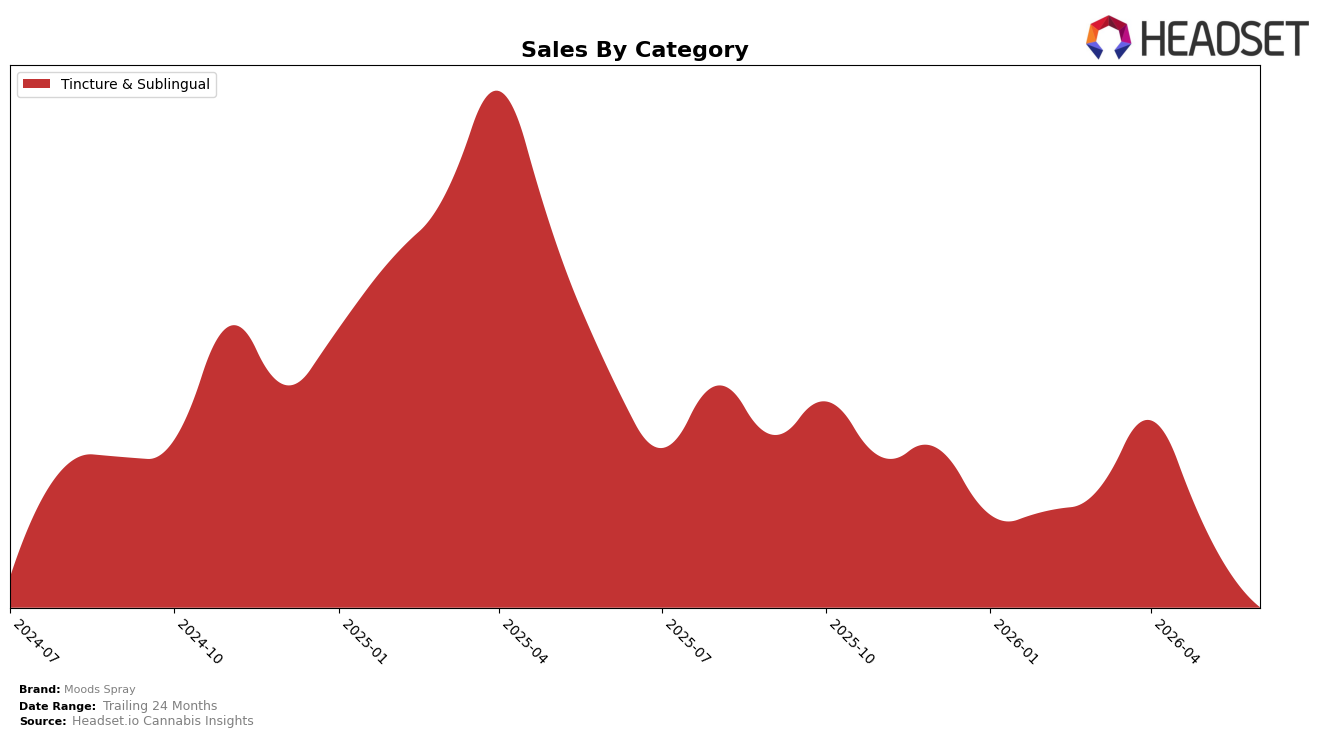
In June 2026, Moods Spray concentrated entirely in Tincture & Sublingual with a 100.0% category share and a rank of 15 in California, while year-over-year sales in this category fell 51.11% and month-over-month declined 26.10%. Average price contracted 5.68% year-over-year to $25.87 as the single-category footprint intensified exposure to a double-digit month-over-month drop and a top-15 rank rather than a top-10 position. The pattern implies that a one-category dependency has amplified volatility: a 100.0% mix paired with a 26.10% monthly slide and a rank of 15 points to category headwinds directly translating into brand-level declines.
The same-category concentration means pricing and velocity must do the heavy lifting: with a 5.68% price reduction not offsetting a 51.11% annual sales decline and a 26.10% monthly drop, the brand’s value proposition is skewed toward volume recovery rather than margin expansion. Holding a rank of 15 while carrying 100.0% of sales in Tincture & Sublingual suggests the near-term positioning hinges on winning within this lane—gaining several rank positions or lifting unit throughput—since diversification is absent; the implication is that any incremental share capture or small rank improvement could disproportionately affect overall performance given the undiluted category mix.
Competitive Landscape
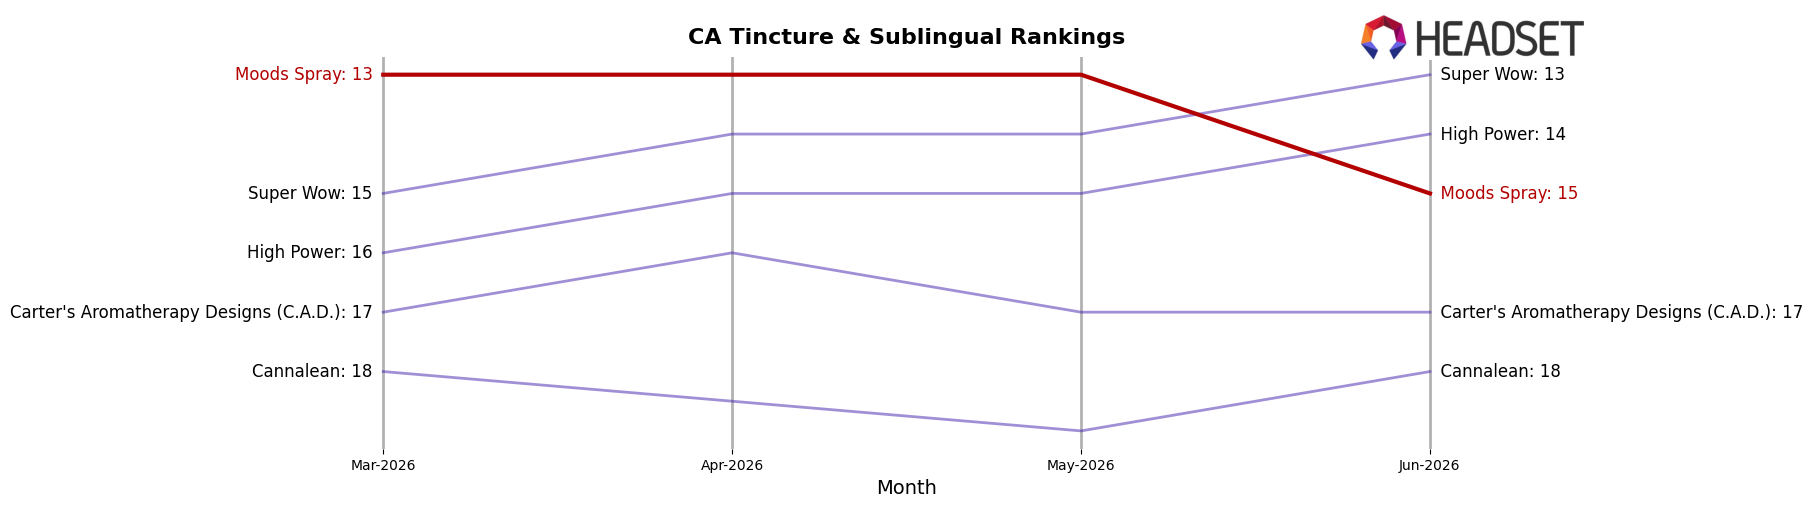
Moods Spray sits at rank #15 in CA Tincture & Sublingual in June 2026, down 4 positions year over year from #11 and slipping 2 spots since March 2026 from #13, while its historical peak was #10 in May 2025; in contrast, Papa & Barkley held #1 year over year and in June 2026 despite a -9.7% YoY sales change, and ABX / AbsoluteXtracts advanced from #7 to #5 alongside a 10.3% YoY sales increase. With Yummi Karma steady at #2 on a 3.3% YoY gain while Care By Design held #3 amid a -9.6% YoY decline, the mix of flat-to-declining leaders and selective climbers implies Moods Spray’s downward rank drift is driven less by broad category contraction and more by missed share capture where competitors with modest growth are consolidating their positions.
Notable Products
Watermelon Z High Sublingual Oral Spray (1000mg THC, 14ml, 0.49fl oz) posted the steepest decline at -65.9% MoM and slid to rank 5, while Blueberry Kush High Sublingual Oral Spray (1000mg THC, 14ml, 0.49fl oz) fell -50.4% MoM to rank 3; in contrast, category leader Peaches and Cream High Sublingual Oral Spray (1000mg) rose 38.7% MoM at rank 1 with $6,117. Four of the top five SKUs are High Sublingual Oral Sprays, concentrating demand in a single format even as individual flavors diverge with -46.7% to -65.9% drops alongside a +38.7% gain. With eight of the top ten sitting in Tincture & Sublingual, the product mix implies Moods Spray is consolidating around high-THC oral sprays where flavor turnover is rapid and winners can displace underperformers quickly.
Top Selling Cannabis Brands
Data for this report comes from real-time sales reporting by participating cannabis retailers via their point-of-sale systems, which are linked up with Headset’s business intelligence software. Headset’s data is very reliable, as it comes digitally direct from our partner retailers. However, the potential does exist for misreporting in the instance of duplicates, incorrectly classified products, inaccurate entry of products into point-of-sale systems, or even simple human error at the point of purchase. Thus, there is a slight margin of error to consider. Brands listed on this page are ranked in the top twenty within the market and product category by total retail sales volume.

