May-2026
Sales
Trend
6-Month
Product Count
SKUs
Avg Price
YoY Sales Change
YoY Price Change
Market Insights Snapshot
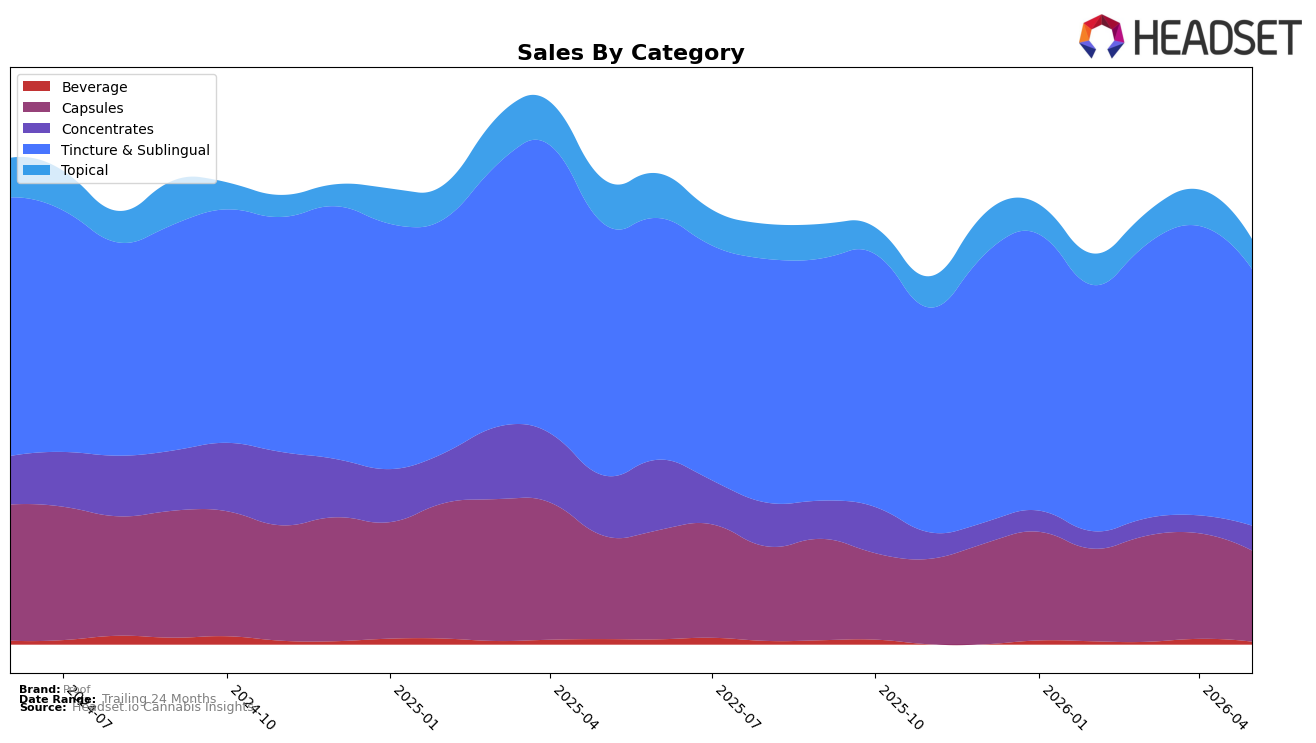
In May 2026, Proof concentrated 62.66% share in Tincture & Sublingual with a 1.97% year-over-year gain but an 11.28% month-over-month decline, while Capsules held 22.42% share with an 11.79% year-over-year drop and a 13.63% month-over-month slide. Topical represented 7.56% share with a 31.71% year-over-year decline and a 17.37% month-over-month decline, contrasted by Concentrates at 6.34% share with a 57.58% year-over-year decline but a 37.04% month-over-month rebound. Beverage was 1.02% share with a 37.97% year-over-year decline and a 39.87% month-over-month decline. The pattern implies Proof’s volume is anchored in Tincture & Sublingual while near-term softness across Capsules and Topical pulls the overall month-over-month trend down, even as Concentrates introduces a tactical month-over-month offset.
Proof’s rank of 7 in Tincture & Sublingual in California, paired with a 6.16% average price increase year over year and a 11.28% month-over-month decline in its lead category, suggests price-led positioning with sensitivity to monthly demand shifts. With brand sales down 12.69% year over year and down 25.20% versus 24 months, the mix’s reliance on categories showing double-digit month-over-month declines (Capsules down 13.63%, Topical down 17.37%) signals that maintaining the number 7 rank likely depends on stabilizing Tincture & Sublingual while selectively leaning into the 37.04% month-over-month recovery in Concentrates; the implication is a need to defend share in the core while using lower-priced Concentrates (average price $24.30) to manage price-tier coverage without diluting the higher-price categories’ role.
Competitive Landscape
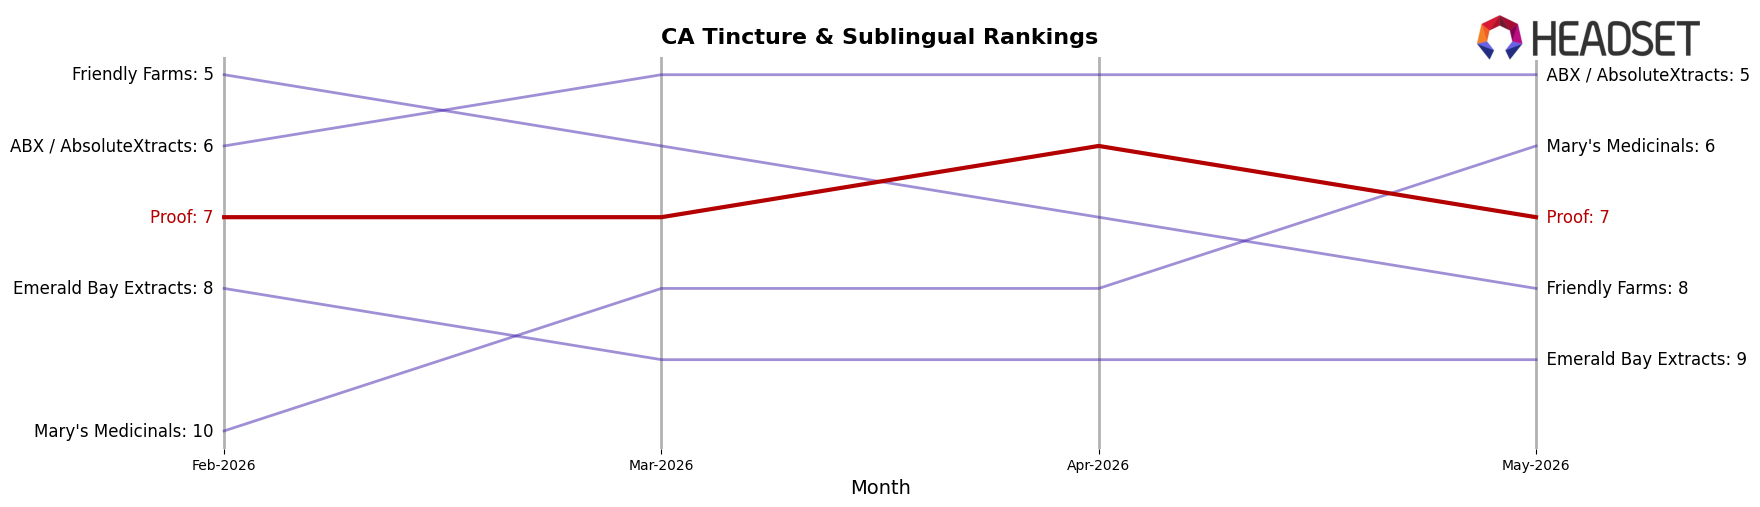
Proof ranks #7 in California Tincture & Sublingual in May 2026, improving 1 position from #8 year over year, while holding flat versus February 2026 at #7; the brand’s peak of #6 in April 2026 indicates a brief upward break before slipping back one spot. In the same period, Papa & Barkley maintained #1 with a -13.3% YoY sales change and ABX / AbsoluteXtracts advanced from #6 to #5 despite a -12.5% YoY sales change, suggesting rank gains are occurring even as category leaders contract; Proof’s +1 YoY rank change alongside a one-rank dip from its April 2026 peak implies incremental share capture but a ceiling near the mid-pack unless momentum extends beyond month-to-month variability.
Notable Products
The steepest movement in May 2026 was the CBD/THC 20:1 Tincture (300mg CBD, 15mg THC, 15ml) dropping 33.0% to rank 7, while the CBD/THC 1:1 Balance Tincture (300mg CBD, 300mg THC, 15ml) fell 32.0% at rank 5, together signaling a demand reset away from lower-THC ratio SKUs. At the top, CBD/THC 1:1 Bazillion Tincture Drops (1000mg CBD, 1000mg THC, 15ml) held rank 1 despite a 10.5% decline, and High THC Tincture (1000mg THC, 15ml) slid 19.3% to rank 2, indicating that even flagship potency tiers softened. With eight of the top ten in Tincture & Sublingual, category concentration remains high even as growth pockets narrow, and the month’s mix implies Proof is leaning into potency-led tinctures while ratio-led offerings face elasticity that may require pricing or pack-size adjustments.
Top Selling Cannabis Brands
Data for this report comes from real-time sales reporting by participating cannabis retailers via their point-of-sale systems, which are linked up with Headset’s business intelligence software. Headset’s data is very reliable, as it comes digitally direct from our partner retailers. However, the potential does exist for misreporting in the instance of duplicates, incorrectly classified products, inaccurate entry of products into point-of-sale systems, or even simple human error at the point of purchase. Thus, there is a slight margin of error to consider. Brands listed on this page are ranked in the top twenty within the market and product category by total retail sales volume.

