Market Insights Snapshot
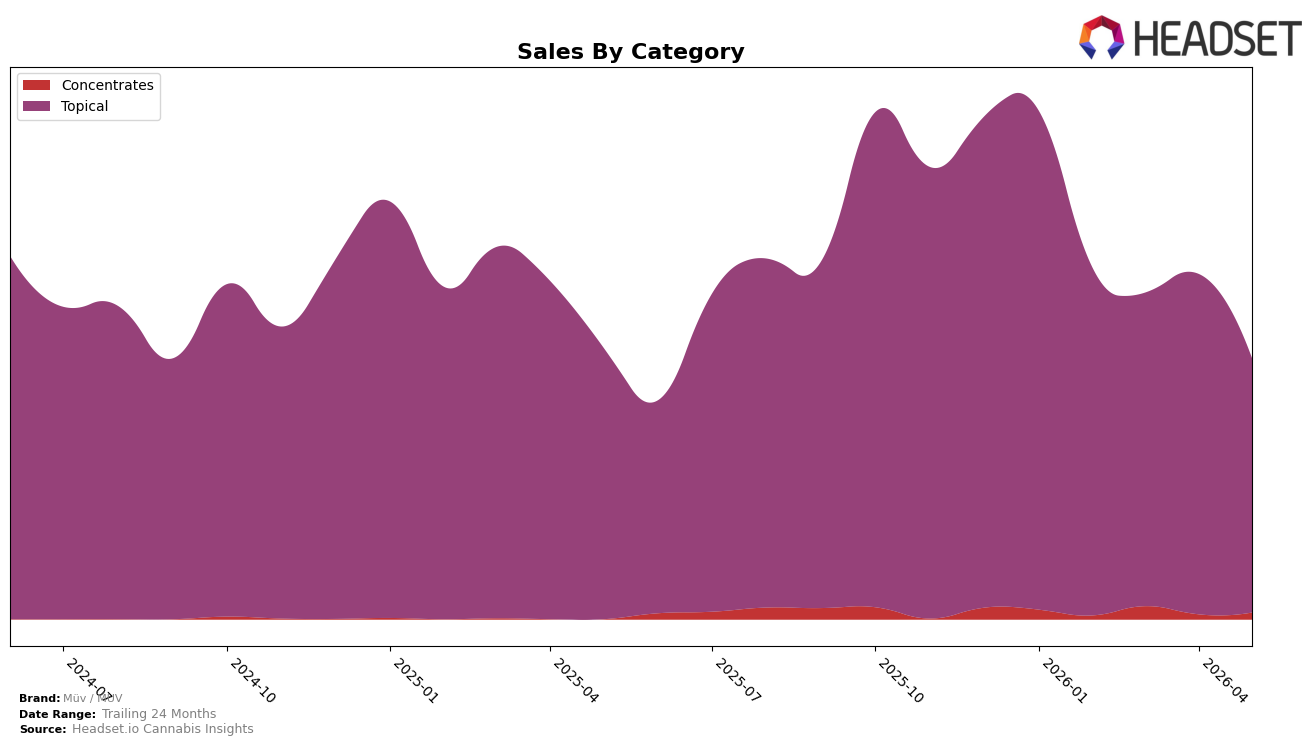
Müv / MUV’s mix in May 2026 is heavily concentrated in Topical at 97.42% share, while Concentrates holds 2.58% share; within this mix, Topical declined 6.35% year over year and fell 25.29% month over month, whereas Concentrates rose 36.55% month over month but remains a small base. Overall brand sales were down 3.87% year over year alongside a 13.52% year-over-year increase in average price, and the brand sits at rank 5 in Topical in Arizona; this combination implies price-led revenue pressure within the core category and a nascent but accelerating test in Concentrates that is not yet material to total share.
The pattern suggests Müv / MUV is anchored to a single-category strategy where concentration risk is rising: a 25.29% month-over-month drop in the 97.42% Topical core amplifies volatility, while the 36.55% month-over-month lift in the 2.58% Concentrates slice is too small to counterbalance. Holding rank 5 in Arizona Topical despite a 6.35% year-over-year Topical decline and a 13.52% year-over-year average price increase indicates the brand is trading on price more than volume; strategically, this positioning implies near-term share defense requires stabilizing Topical velocity while selectively scaling Concentrates to dilute category concentration without materially eroding price.
Competitive Landscape
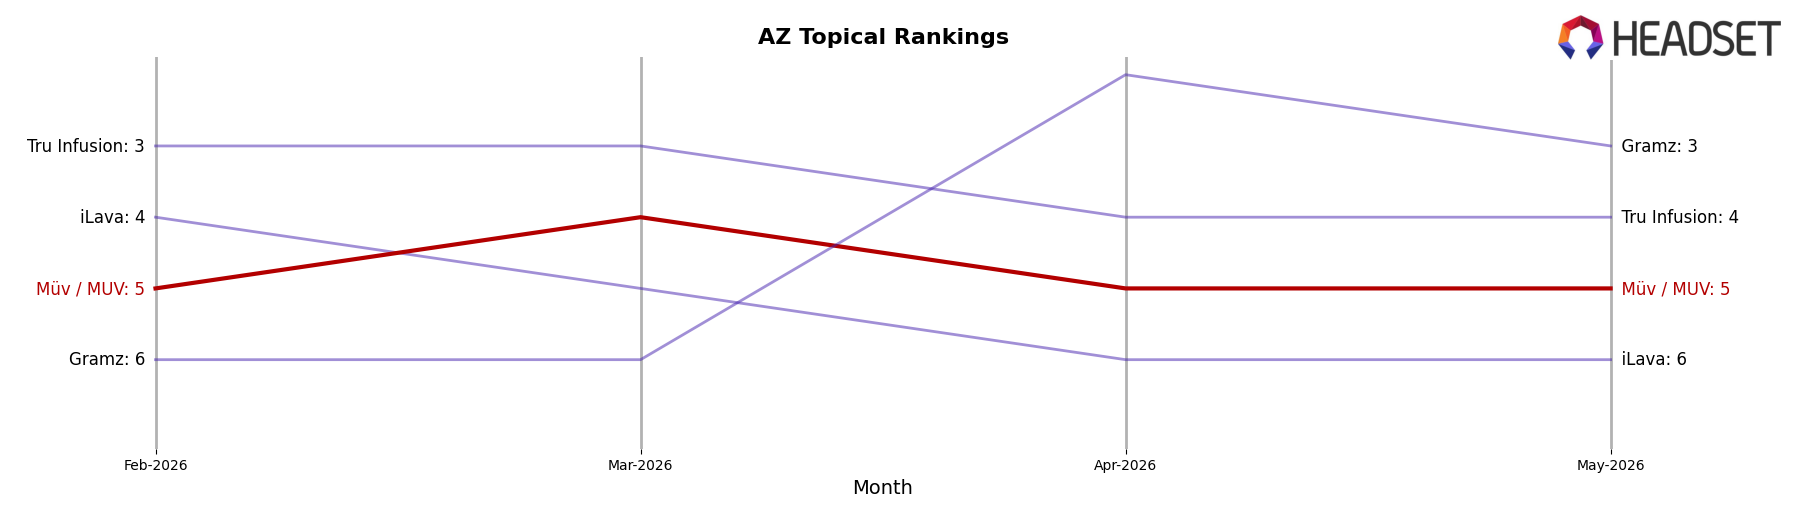
Müv / MUV sits at rank #5 in AZ Topical for May 2026, a 1-place improvement from #6 in May 2025, while holding the same #5 position as February 2026 and coming off a peak of #2 in January 2026; in contrast, Drip Oils + Extracts moved from #2 to #1 with 38.3% YoY sales growth and Gramz climbed from #7 to #3 with 123.2% YoY growth, whereas Tru Infusion held #4 with a 14.7% YoY decline and Chronic Health improved from #3 to #2 despite a 28.0% YoY drop; this mix of upward mobility at the top and negative growth among incumbents indicates that Müv / MUV’s modest rank gain alongside a retreat from its January 2026 peak implies stabilization in the mid-tier rather than a near-term path back to the top three.
Notable Products
CBD/THC 1:1 Transdermal Patch (10mg CBD, 10mg THC) posted the standout move in May 2026 with an 84.99% month-over-month surge and climbed to rank 5, while the CBD/THC 1:1 Soothing Sports Gel (100mg CBD, 100mg THC) fell 31.29% yet held rank 1. CBD/THC 1:1 Pain Relief Cream (100mg CBD, 100mg THC) declined 31.52% at rank 4 as its higher-dosage counterpart rose 19.73% at rank 8, and six of the top ten are Topical SKUs concentrated in 1:1 CBD/THC formats. The CBD/THC 1:1 Transdermal Patch Gen2 (10mg CBD, 10mg THC) dropped 34.40% at rank 2 while the legacy 10mg patch rose, suggesting substitution from Gen2 back to the original at lower price points, with total-category dollars centered around a single product family. The pattern implies a pivot toward lower-dose, legacy 1:1 patch formats within Topicals as the commercial anchor, with price-sensitive repeat purchasing outweighing premium Gen2 upgrades.
Top Selling Cannabis Brands
Data for this report comes from real-time sales reporting by participating cannabis retailers via their point-of-sale systems, which are linked up with Headset’s business intelligence software. Headset’s data is very reliable, as it comes digitally direct from our partner retailers. However, the potential does exist for misreporting in the instance of duplicates, incorrectly classified products, inaccurate entry of products into point-of-sale systems, or even simple human error at the point of purchase. Thus, there is a slight margin of error to consider. Brands listed on this page are ranked in the top twenty within the market and product category by total retail sales volume.

