.svg)

Sep-2026
Sales
Trend
6-Month
Product Count
SKUs
Avg Price
YoY Sales Change
YoY Price Change


Where to Buy
Gramz is stocked at 26 licensed dispensaries across Arizona, with the deepest coverage in Phoenix, Mesa, Tucson, Chandler, and El Mirage. Search by ZIP code or city below to find the closest one.
Market Insights Snapshot
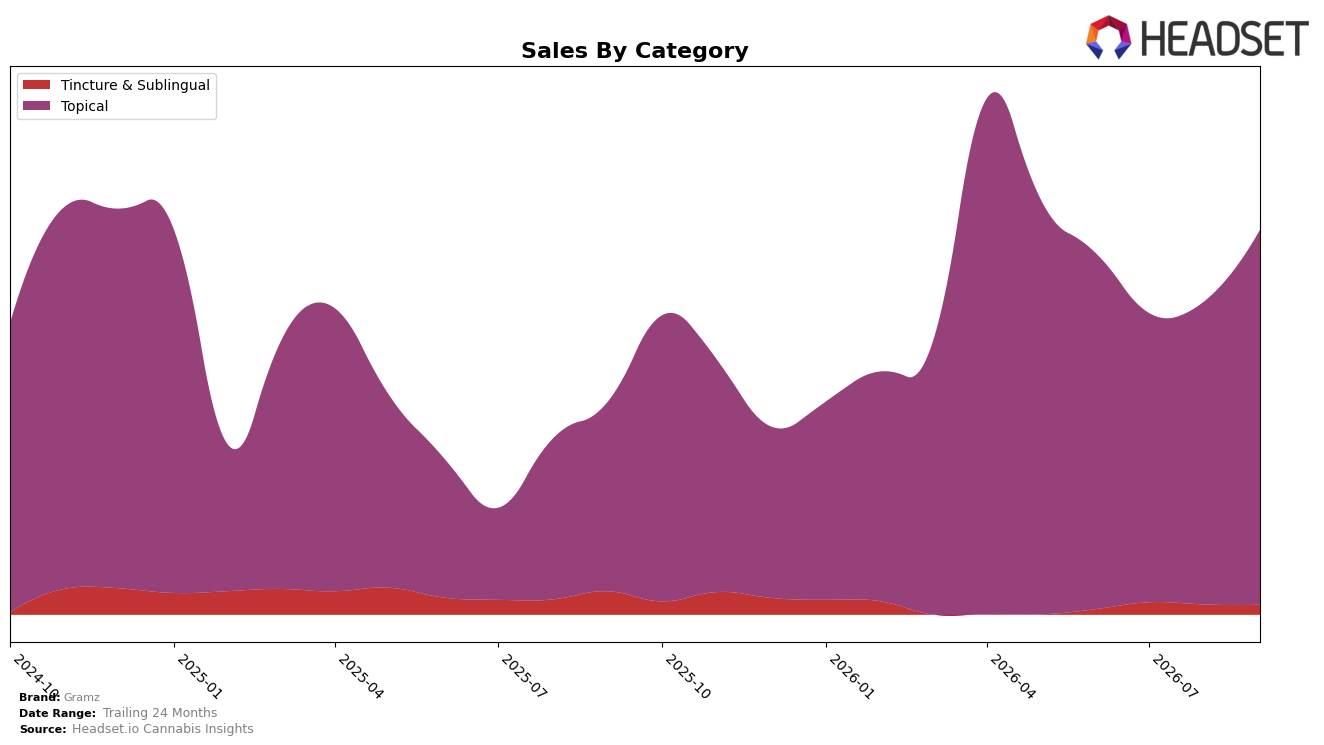
In September 2026, Gramz concentrated 97.48% of sales in Topical, up 23.61% month over month and 97.32% year over year, while Tincture & Sublingual fell to 2.52% share with a -2.25% MoM and -57.92% YoY decline. The brand’s overall sales rose 80.55% YoY alongside a 10.78% YoY increase in average price to $38.44, indicating mix-driven uplift anchored in higher-priced Topical (average price $39.21) versus lower-priced Tincture & Sublingual ($21.84). With Topical ranked 2 in Arizona, the tilt toward Topical and the concurrent contraction in Tincture & Sublingual imply a deliberate focus on a category where Gramz has rank momentum and pricing power.
The Topical-heavy mix (97.48% share) combined with 23.61% MoM growth and a 2-to-1 price premium over Tincture & Sublingual supports a positioning centered on therapeutic-use Topicals rather than ingestibles, and the -57.92% YoY decline in Tincture & Sublingual indicates de-prioritization rather than temporary volatility. Given the category rank of 2 in Arizona and the 80.55% YoY brand growth, Gramz is aligning resources toward a category where price elasticity appears favorable and where incremental share gains are more attainable than in its 2.52% share tail, implying a strategy to consolidate leadership in Topical before re-expanding breadth.
Competitive Landscape
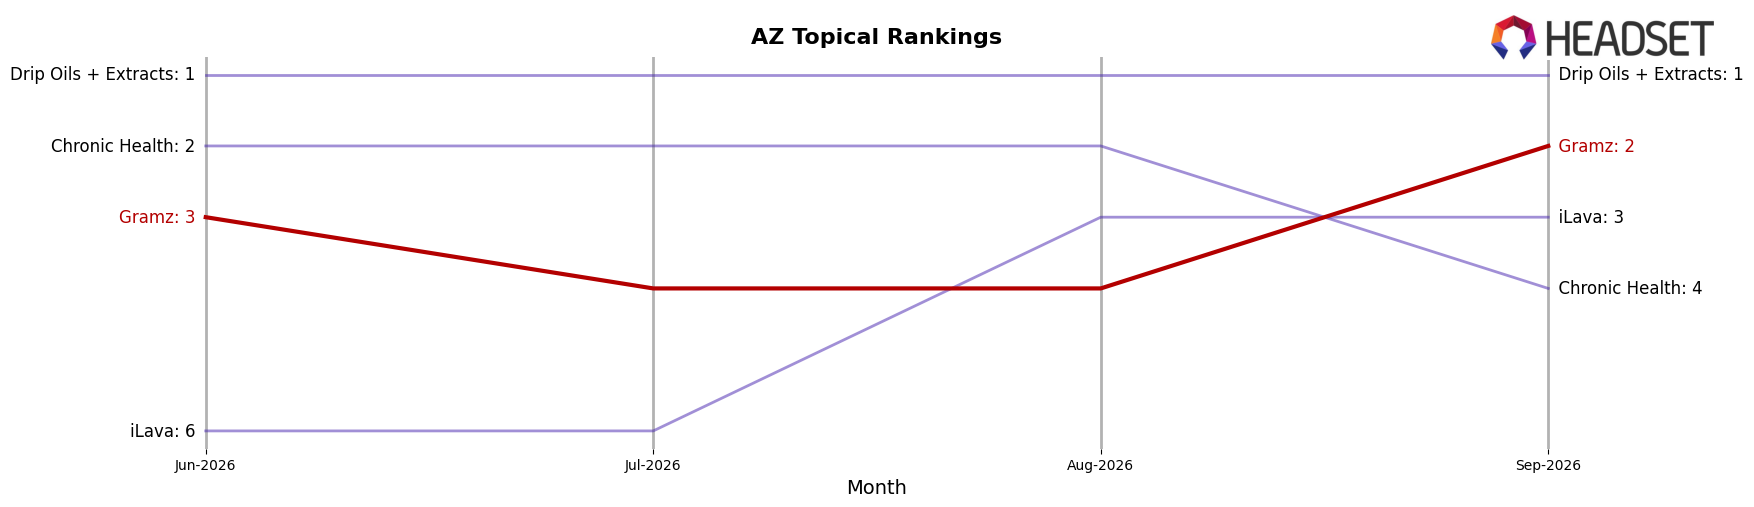
Gramz sits at rank #2 in AZ Topical with a year-over-year climb from #7, while a three-month move from #3 to #2 signals accelerating share capture; in contrast, Drip Oils + Extracts held #1 both year-over-year and in September 2026 as its sales grew 49.7%, and iLava slipped from #4 to #3 with sales down 8.9%. Further down, Chronic Health fell from #2 to #4 alongside a 28.0% sales decline, and Tru Infusion stayed at #5 while sales contracted 46.3%, positioning Gramz’s rise to its peak rank #2 in September 2026 as a share-rotation outcome where weakness below and stability above create a narrow path to challenge #1.
Notable Products
CBD/THC 1:1 Herbal Lotion (300mg CBD, 300mg THC) led September 2026 with a 24.6% month-over-month rise to $24,671 and maintained rank 1, while CBG/THC 1:2 Essential Roll On Oil Cream (50mg CBG, 100mg THC) climbed 27.6% to rank 2; both gains contrast with a 1.5% dip for CBG/THC 1:2 G9 Herbal Aphrodisiac Libido Booster (50mg CBG, 100mg THC) at rank 3. With three of the top four SKUs in Topical, concentration in this format widened as Tincture & Sublingual slipped 2.3% and sat at rank 4; this mix implies Gramz is consolidating traction in Topical over sublingual formats. The pattern suggests near-term portfolio emphasis should lean into Topical innovation and distribution while monitoring the softening in aphrodisiac-positioned items.
Top Selling Cannabis Brands






Data for this report comes from real-time sales reporting by participating cannabis retailers via their point-of-sale systems, which are linked up with Headset’s business intelligence software. Headset’s data is very reliable, as it comes digitally direct from our partner retailers. However, the potential does exist for misreporting in the instance of duplicates, incorrectly classified products, inaccurate entry of products into point-of-sale systems, or even simple human error at the point of purchase. Thus, there is a slight margin of error to consider. Brands listed on this page are ranked in the top twenty within the market and product category by total retail sales volume.

