Jun-2026
Sales
Trend
6-Month
Product Count
SKUs
Avg Price
YoY Sales Change
YoY Price Change
Market Insights Snapshot
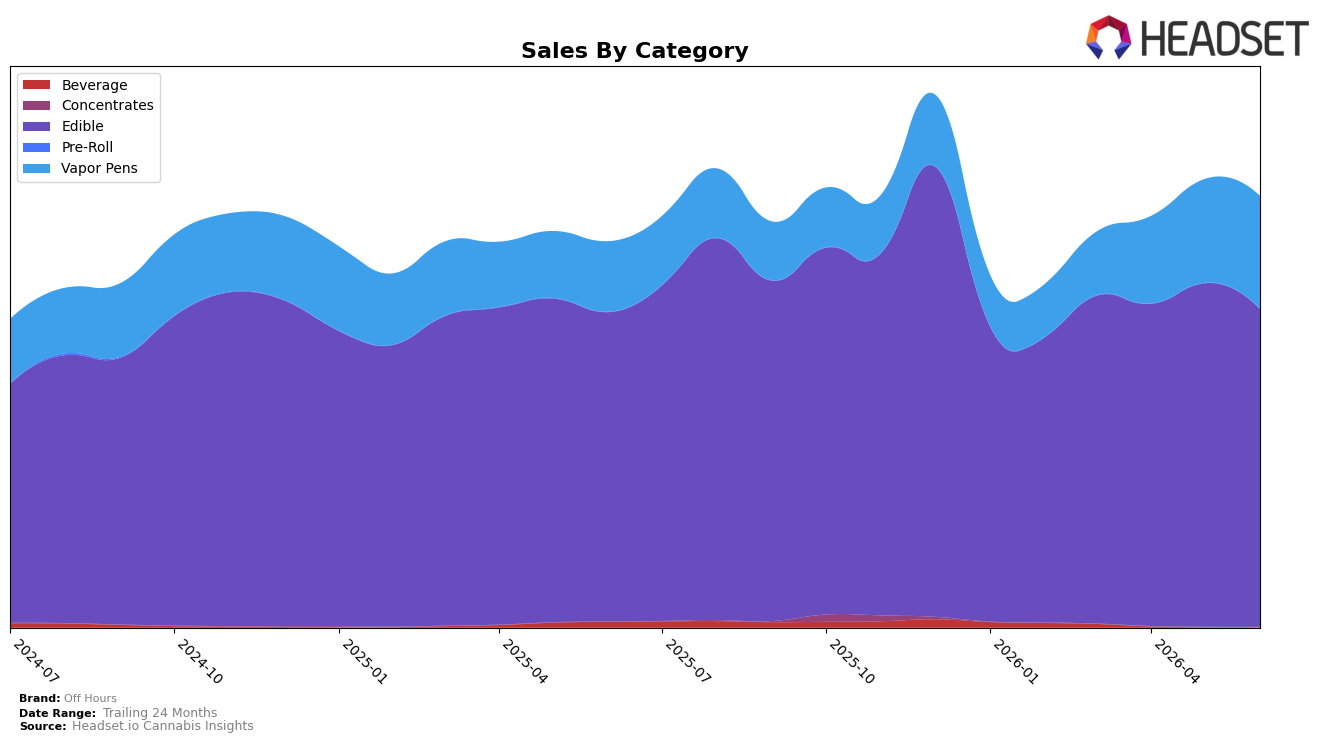
Off Hours concentrated 73.81% of sales in Edible during June 2026 while Vapor Pens rose to 26.17% share, indicating a two-pillar mix with Edible slipping month over month by 7.55% and Vapor Pens gaining 8.74% month over month. Year over year, Vapor Pens expanded 60.46% versus Edible at 2.75%, and Beverage collapsed 99.09% year over year to a 0.01% share with a 53.03% month-over-month decline, effectively exiting the mix. With Off Hours ranked 2 in Edible in New York alongside a 9.16% year-over-year average price decrease and a 11.78% brand-level sales increase, the pattern implies the brand is leaning on Edible scale for rank while reallocating momentum to Vapor Pens to offset short-term Edible softness.
The shift toward Vapor Pens (up 60.46% year over year and +8.74% month over month) alongside Edible’s month-over-month contraction of 7.55% and modest 2.75% year-over-year growth signals a hedging strategy that broadens exposure to faster-cycling formats without abandoning Edible’s scale at a 73.81% share. Holding the number 2 Edible rank in New York while dropping average price by 9.16% year over year and sustaining a 11.78% total sales lift suggests price-led defense in Edible paired with mix-led offense in Vapor Pens, implying Off Hours is trading some margin for share retention in its core while capturing incremental trips in a premium-adjacent pen tier at a $30.39 average price.
Competitive Landscape
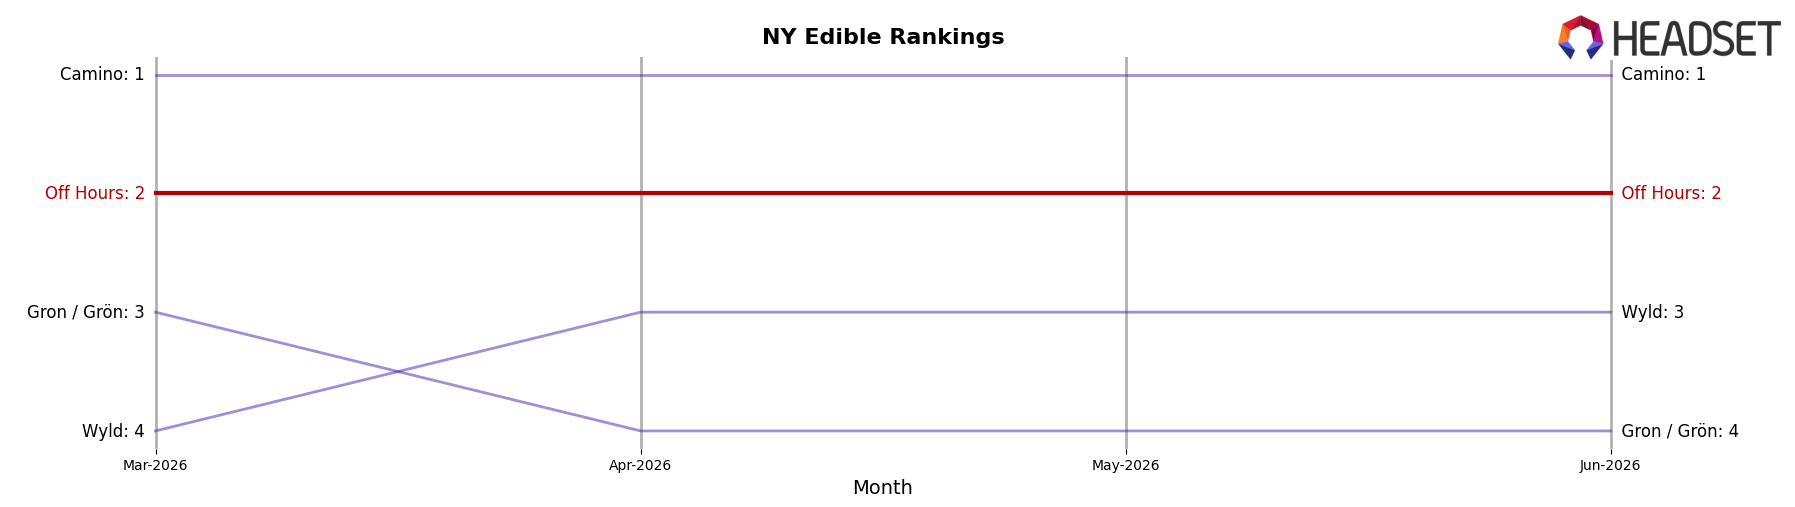
Off Hours is currently ranked #2 in NY Edible for June 2026, down 1 position year over year from #1, while holding the same #2 spot since March 2026 and having previously peaked at #1 in October 2025; in contrast, Camino sits at #1 after rising from #2 year over year and Wyld remains at #3 with a 26.0% year-over-year sales increase, indicating that Off Hours’ slight rank erosion alongside a stable 3-month position points to a maturing placement where incremental share shifts against rising leaders will determine whether it reclaims #1 or settles into a sustained #2 slot.
Notable Products
Focus - CBD/THC/CBG 2:10:10 Cherry Limeade Limelight Sour Gummies 10-Pack (20mg CBD, 100mg THC, 100mg CBG) posted the sharpest movement in June 2026 with a +7.7% MoM lift into rank 10, while Euphoric - THC/CBG 10:2 Watermelon Lemonade Sour Gummies 10-Pack (100mg THC, 20mg CBG) slipped -5.4% but held rank 1. Offline - CBD/THC/CBN 2:10:3 Grape Punch Gummies 10-Pack (20mg CBD, 100mg THC, 30mg CBN) fell -9.1% at rank 6 as CBD/THC/CBN mixes split performance, whereas CBD/THC/CBN 2:10:1 Mellow Blue Razzberry Sour Gummies 10-Pack (20mg CBD, 100mg THC, 10mg CBN) in rank 2 grew +4.0% with $270,318 in sales. All ten top products are Edible SKUs and nine of the top ten carry multi-cannabinoid blends, implying Off Hours is consolidating around function-forward gummies while pruning weaker CBN-heavy variants.
Top Selling Cannabis Brands
Data for this report comes from real-time sales reporting by participating cannabis retailers via their point-of-sale systems, which are linked up with Headset’s business intelligence software. Headset’s data is very reliable, as it comes digitally direct from our partner retailers. However, the potential does exist for misreporting in the instance of duplicates, incorrectly classified products, inaccurate entry of products into point-of-sale systems, or even simple human error at the point of purchase. Thus, there is a slight margin of error to consider. Brands listed on this page are ranked in the top twenty within the market and product category by total retail sales volume.

