.svg)


Market Insights Snapshot
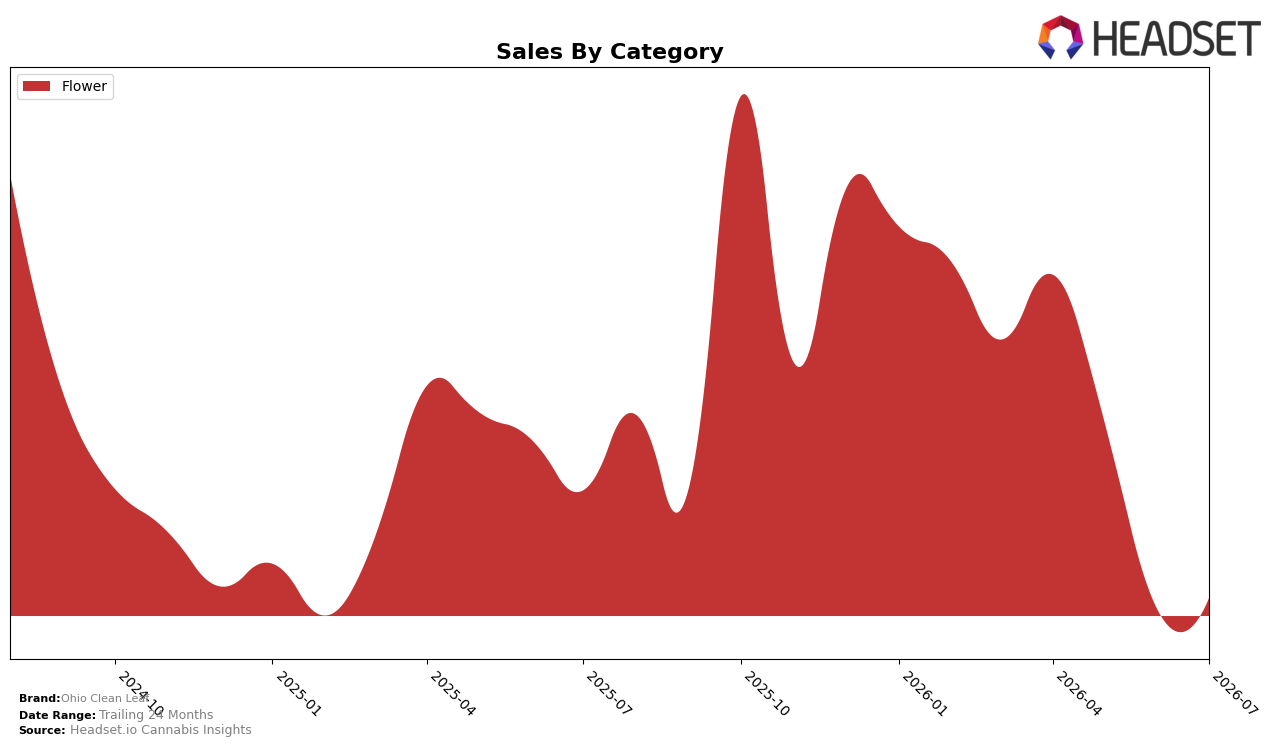
In July 2026, Ohio Clean Leaf’s category mix is fully concentrated in Flower at 100.0% share, with category sales up 10.47% month over month but down 45.86% year over year. Average price increased 11.82% YoY to $45.63 while the brand’s Flower rank in Ohio sits at 48, indicating that a double‑digit MoM lift did not translate into a higher competitive position. The pattern implies the brand is relying on a single-category rebound to offset a steep annual decline, with rising prices outpacing category recovery and constraining share expansion.
The combination of a 100.0% Flower dependency and a 45.86% YoY sales drop, alongside a 10.47% MoM uptick and a 48th rank in Ohio, implies a positioning skewed toward premium-priced Flower that is under-penetrating broader demand tiers. With average price up 11.82% YoY as total sales declined 45.86% YoY, the mix suggests pricing strategy is dampening volume elasticity rather than gaining rank. The thesis is that without diversifying beyond Flower or recalibrating price architecture, the brand’s MoM gains are likely to remain tactical lifts that do not improve rank or share in Ohio.
Competitive Landscape
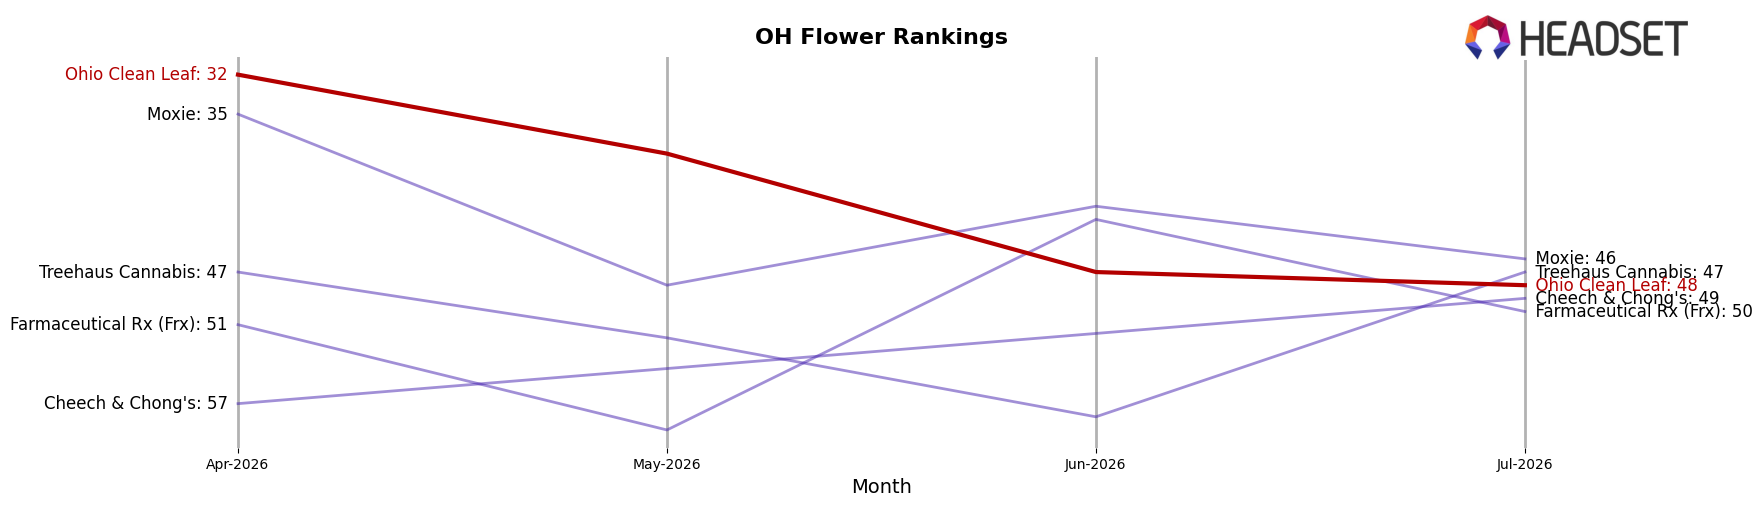
Ohio Clean Leaf sits at rank #48 in July 2026, sliding 8 positions year over year from #40, and falling 16 spots from its April 2026 placement at #32; by contrast, RYTHM advanced from #6 to #1 with 74.99% year-over-year sales growth while Klutch Cannabis climbed from #21 to #3 alongside a 403.04% surge, indicating that Ohio Clean Leaf’s move from a peak of #19 in October 2025 to #48 now reflects share being captured by faster-rising leaders and implies a continued down-tiering unless assortment or pricing resets the trajectory.
Notable Products
Banana Puddintain (14.15g) posted the standout move in July 2026 with a 246.9% month-over-month surge to rank 3, while Banana Puddintain (2.83g) fell 55.0% and dropped to rank 4, signaling a rapid shift from eighths toward half-ounce formats. Solo Burger (14.15g) advanced 60.9% to rank 5 as Solo Burger (2.83g) slid 23.8% at rank 1, and Planet Bang Bang (14.15g) jumped 199.1% to rank 6, reinforcing that larger Flower sizes are gaining traction even as top eighths cool. With five of the top six SKUs in Flower and three of them in 14.15g packs, the mix points to Ohio Clean Leaf leaning into value-oriented larger formats to drive volume and defend share.
Top Selling Cannabis Brands






Data for this report comes from real-time sales reporting by participating cannabis retailers via their point-of-sale systems, which are linked up with Headset’s business intelligence software. Headset’s data is very reliable, as it comes digitally direct from our partner retailers. However, the potential does exist for misreporting in the instance of duplicates, incorrectly classified products, inaccurate entry of products into point-of-sale systems, or even simple human error at the point of purchase. Thus, there is a slight margin of error to consider. Brands listed on this page are ranked in the top twenty within the market and product category by total retail sales volume.

