Jun-2026
Sales
Trend
6-Month
Product Count
SKUs
Avg Price
YoY Sales Change
YoY Price Change
Market Insights Snapshot
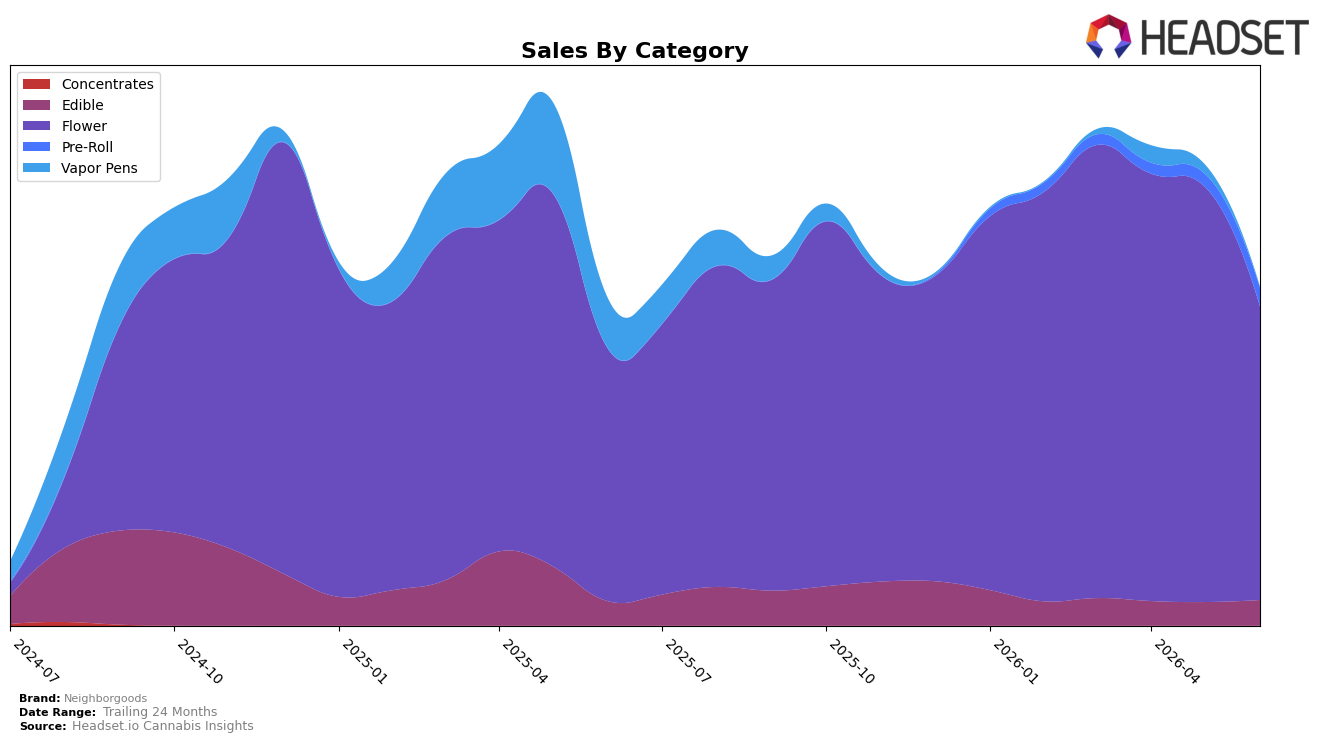
Neighborgoods concentrated 86.83% of June 2026 sales in Flower with a 16.48% year-over-year lift but a 29.39% month-over-month pullback, while Edible held 7.49% share with 5.32% YoY growth and 8.76% MoM expansion. Pre-Roll accounted for 5.42% share with a 45.30% MoM rise off a small base, and Vapor Pens fell to 0.25% share with a 98.28% YoY decline and 90.59% MoM drop. With average price up 20.30% YoY to $33.48 and Flower’s average price at 45.30, the mix skews toward higher-ticket units even as monthly volume softened in the core; the pattern implies short-term dependence on Ohio Flower is creating volatility while secondary formats are beginning to diversify revenue contribution.
Flower’s 86.83% share alongside a rank of 7 in Ohio suggests a concentrated but defensible position, yet the 29.39% MoM decline in Flower coupled with a 45.30% MoM surge in Pre-Roll indicates substitution risk and trial migration within inhalables. Edible’s 8.76% MoM growth against Vapor Pens’ 90.59% MoM contraction and 98.28% YoY decline points to consumer preference consolidating around smokeable and ingestible forms rather than vapes; the implication is that Neighborgoods can stabilize rank by leaning into Pre-Roll and Edible to smooth Flower cyclicality while using Flower’s higher average price to preserve margin.
Competitive Landscape
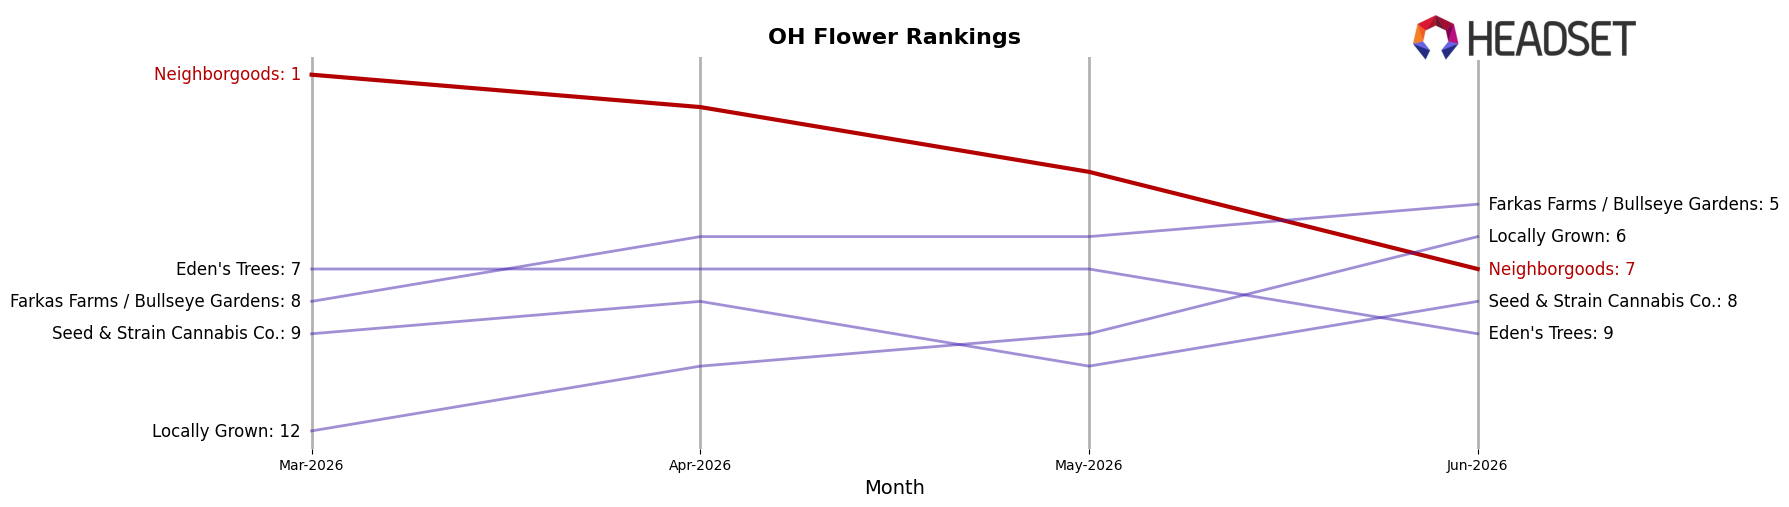
Neighborgoods ranks #7 in OH Flower in June 2026 after a year-over-year climb from #8, but it slid 6 positions from a peak at #1 in March 2026 to #7 by June 2026; this contrasts with Klutch Cannabis moving from #20 to #1 alongside a 304.8% YoY sales increase and RYTHM advancing from #6 to #3 with 67.7% YoY growth, while Riviera Creek held near the top at #2 despite a -22.7% YoY decline; taken together, the YoY uptick in rank (+1) paired with a quarter-to-date fall from #1 to #7 signals that Neighborgoods’ position is stabilizing on a longer horizon but losing short-term share to faster risers.
Notable Products
Indica x Indica Pre-Roll (1g) delivered the standout move with +153.7% MoM to rank 1, while Black Amber (14.15g) fell -50.4% to rank 8, indicating demand pivoting from bulk Flower toward ready-to-use formats. Hybrid Multi-Strain Pre-Roll (1g) held rank 2 with a modest +2.7% MoM and Mixed Sativa Pre-Roll (1g) climbed +40.0% at rank 3, and with three Pre-Rolls inside the top three, June 2026 concentrated power in quick-consumption SKUs. Egg Roll (14.15g) dropped -30.7% at rank 9 as Cap J (2.83g) slid -37.2% at rank 6, and Flower still placed four items in the top ten but ceded the highest ranks to Pre-Rolls despite single-SKU sales like $126,101 not preventing share erosion at the top. The pattern implies Neighborgoods is migrating demand toward Pre-Rolls at the expense of larger Flower packs, signaling a commercial shift toward velocity and accessibility over bulk volume.
Top Selling Cannabis Brands
Data for this report comes from real-time sales reporting by participating cannabis retailers via their point-of-sale systems, which are linked up with Headset’s business intelligence software. Headset’s data is very reliable, as it comes digitally direct from our partner retailers. However, the potential does exist for misreporting in the instance of duplicates, incorrectly classified products, inaccurate entry of products into point-of-sale systems, or even simple human error at the point of purchase. Thus, there is a slight margin of error to consider. Brands listed on this page are ranked in the top twenty within the market and product category by total retail sales volume.

