Market Insights Snapshot
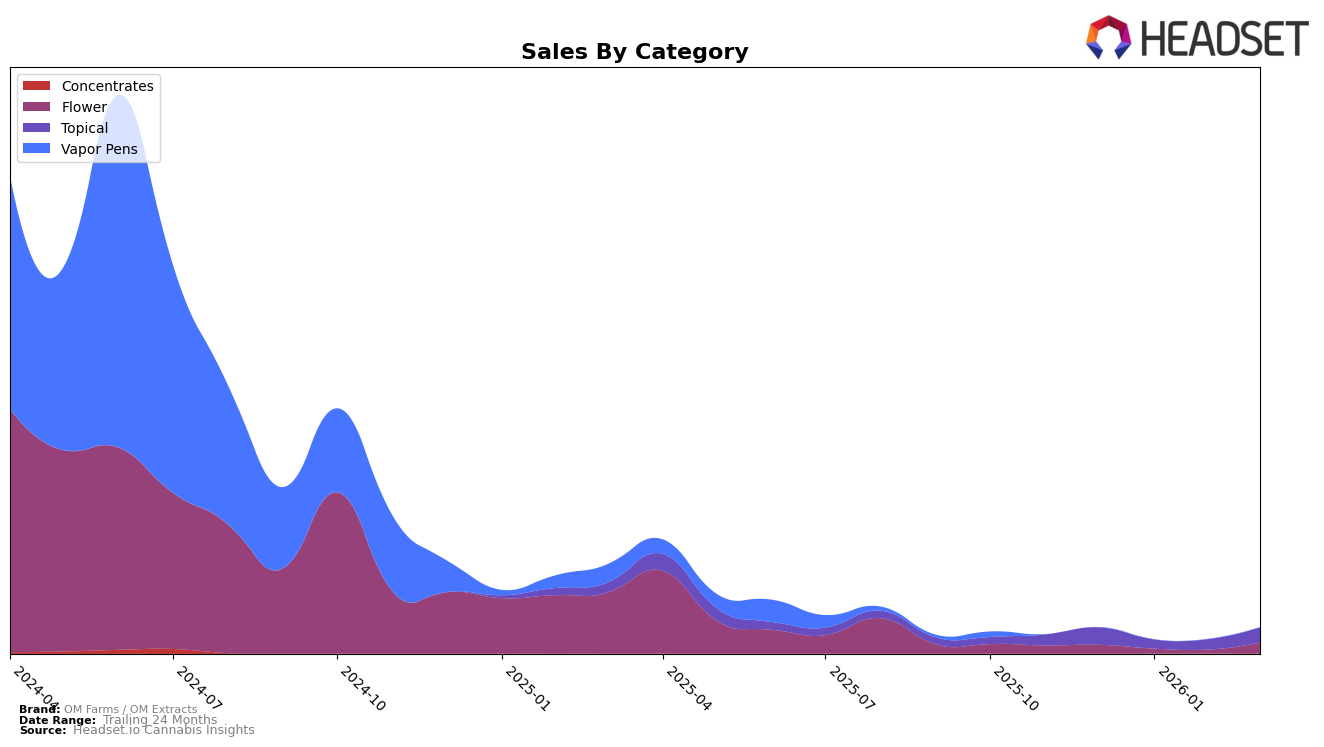
OM Farms / OM Extracts has shown varied performance across different categories and states, with notable activity in the Oregon market. In December 2025, the brand held the 7th position in the Topical category in Oregon, indicating a strong presence in this specific product line. However, the absence of rankings in subsequent months suggests that the brand did not maintain a top 30 position in this category beyond December, which could be seen as a decline in competitive standing or market share within the state.
The lack of data for January through March 2026 in the Topical category for Oregon might imply challenges OM Farms / OM Extracts faced in maintaining their market position, or it could reflect shifts in consumer preferences or increased competition. Despite this, the December sales figure of $10,672 highlights a noteworthy performance during that month, suggesting potential for recovery if strategic adjustments are made. Observing trends and movements in other states and categories would provide a comprehensive understanding of the brand's overall market dynamics and strategy effectiveness.
Competitive Landscape
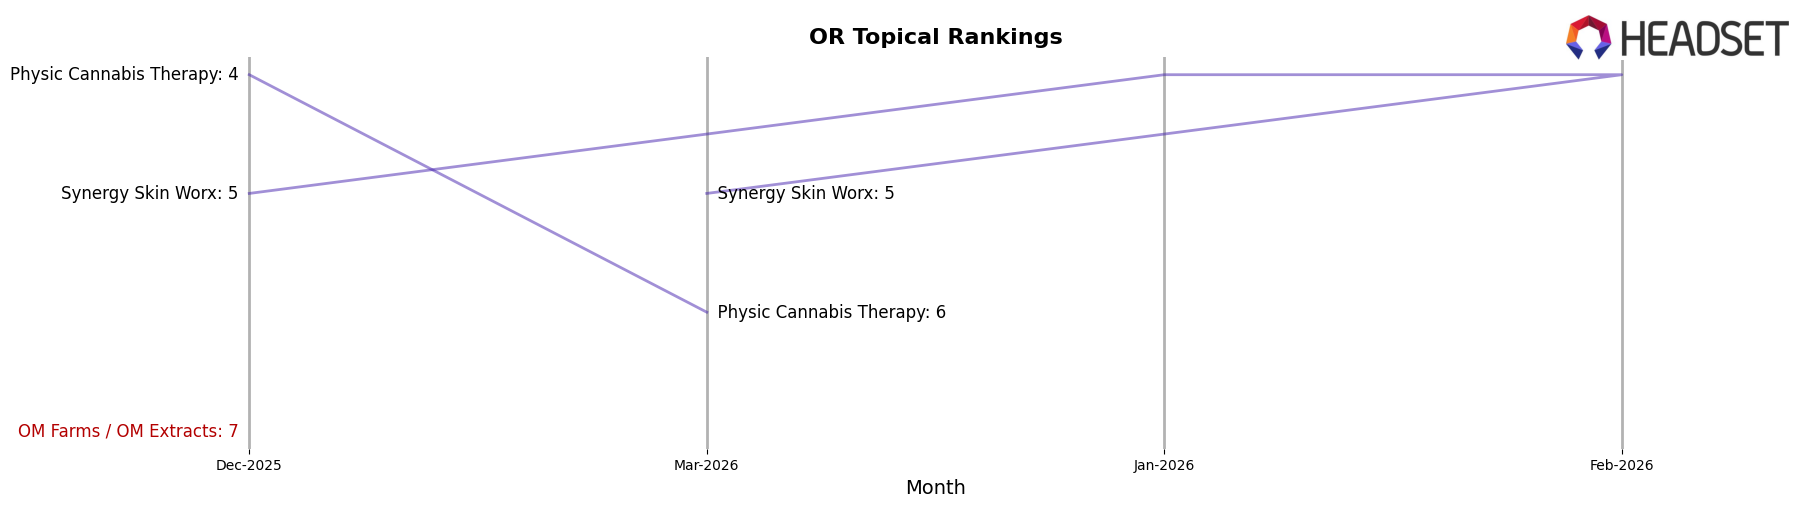
In the Oregon topical cannabis market, OM Farms / OM Extracts experienced a notable absence from the top 20 rankings from January to March 2026, following a 7th place position in December 2025. This suggests a significant decline in market presence, potentially impacting sales momentum. In contrast, Physic Cannabis Therapy maintained a strong position, ranking 4th in December 2025 and 6th in March 2026, indicating a stable market presence. Meanwhile, Synergy Skin Worx showed consistent performance, holding a top 5 position throughout the period, with ranks fluctuating slightly between 4th and 5th place. This competitive landscape highlights the challenges OM Farms / OM Extracts faces in regaining its market share amidst strong and consistent competitors.
Notable Products
In March 2026, OM Farms / OM Extracts maintained its leadership position in the topical category with CBD/THC 1:1 Time To Relax Lavender Epsom Bath Salts consistently holding the top rank, achieving notable sales of $293. The CBD/THC 1:1 Arnica Relief Bath Salts also retained its position as the second best-selling product. Oreoz Preground emerged as the third-ranked product in the flower category, marking its entry into the rankings. V6 Haze Shake, also in the flower category, saw a rise to the fourth position from its previous absence in the rankings. The CBD/THC 1:1 Balance Recovery Bath Salts, although still in the top five, dropped to the fifth position compared to its third-place ranking in February 2026.
Top Selling Cannabis Brands
Data for this report comes from real-time sales reporting by participating cannabis retailers via their point-of-sale systems, which are linked up with Headset’s business intelligence software. Headset’s data is very reliable, as it comes digitally direct from our partner retailers. However, the potential does exist for misreporting in the instance of duplicates, incorrectly classified products, inaccurate entry of products into point-of-sale systems, or even simple human error at the point of purchase. Thus, there is a slight margin of error to consider. Brands listed on this page are ranked in the top twenty within the market and product category by total retail sales volume.

