Market Insights Snapshot
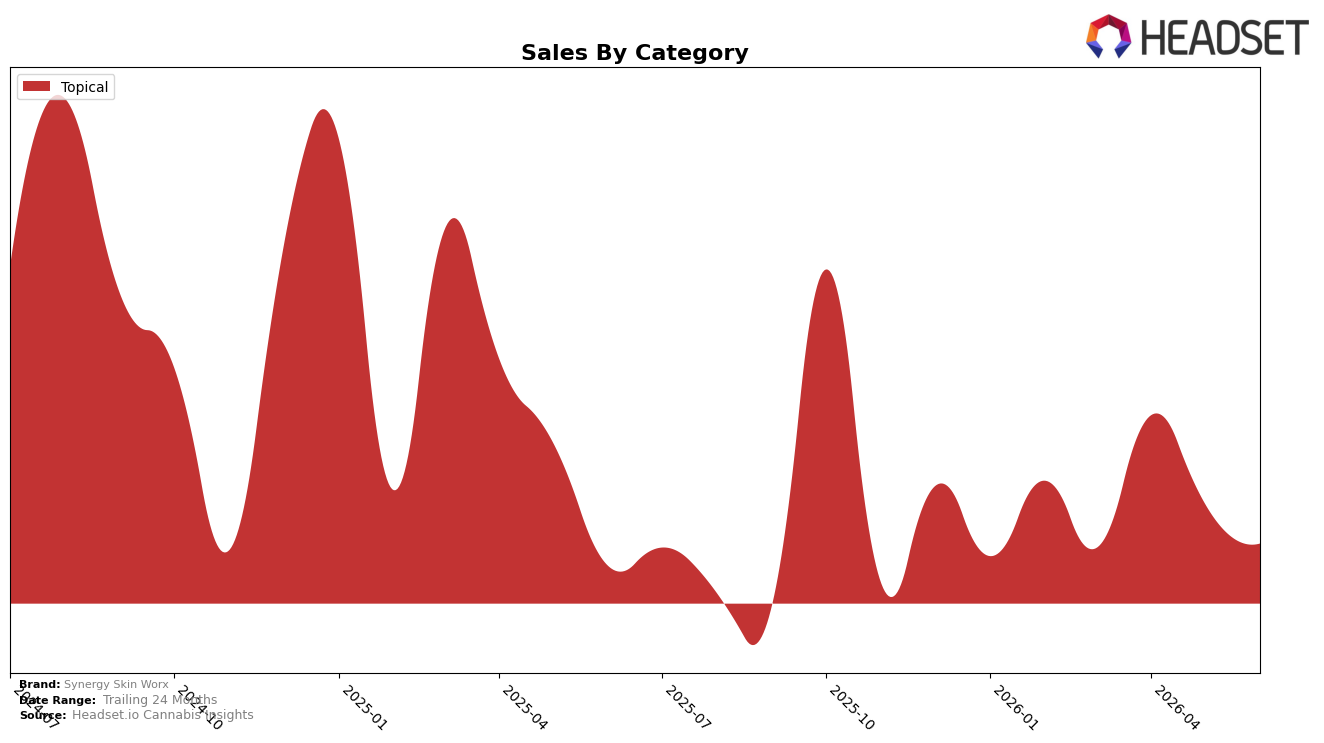
In June 2026, Synergy Skin Worx operated as a single-category brand with Topical accounting for 100.0% of sales, posting a year-over-year change of 6.19% and a month-over-month decline of 9.49%. The average price decreased 1.60% year over year to $13.97, while the brand’s two-year sales trajectory sat at -19.54%, indicating longer-cycle contraction alongside the current-month pullback. With Topical concentration at 100.0% and a current rank of #4 in Oregon Topical, the mix suggests that June 2026 growth came from volume rather than pricing, and the negative month-over-month print implies short-term softness within a narrowly focused portfolio.
The juxtaposition of a 6.19% year-over-year lift against a 9.49% month-over-month decline implies Synergy Skin Worx benefited from a favorable annual comp but lost near-term velocity, likely tied to demand seasonality or promotional timing in Topical. Holding #4 in Oregon Topical while carrying 100.0% category exposure means positioning hinges on defending share through depth within Topical rather than diversification; the 1.60% price decrease year over year suggests the brand is competing on accessible price points to sustain trips, but the -19.54% two-year trend indicates that maintaining rank will require mix innovation or upsell within Topical to counter medium-term share erosion.
Competitive Landscape
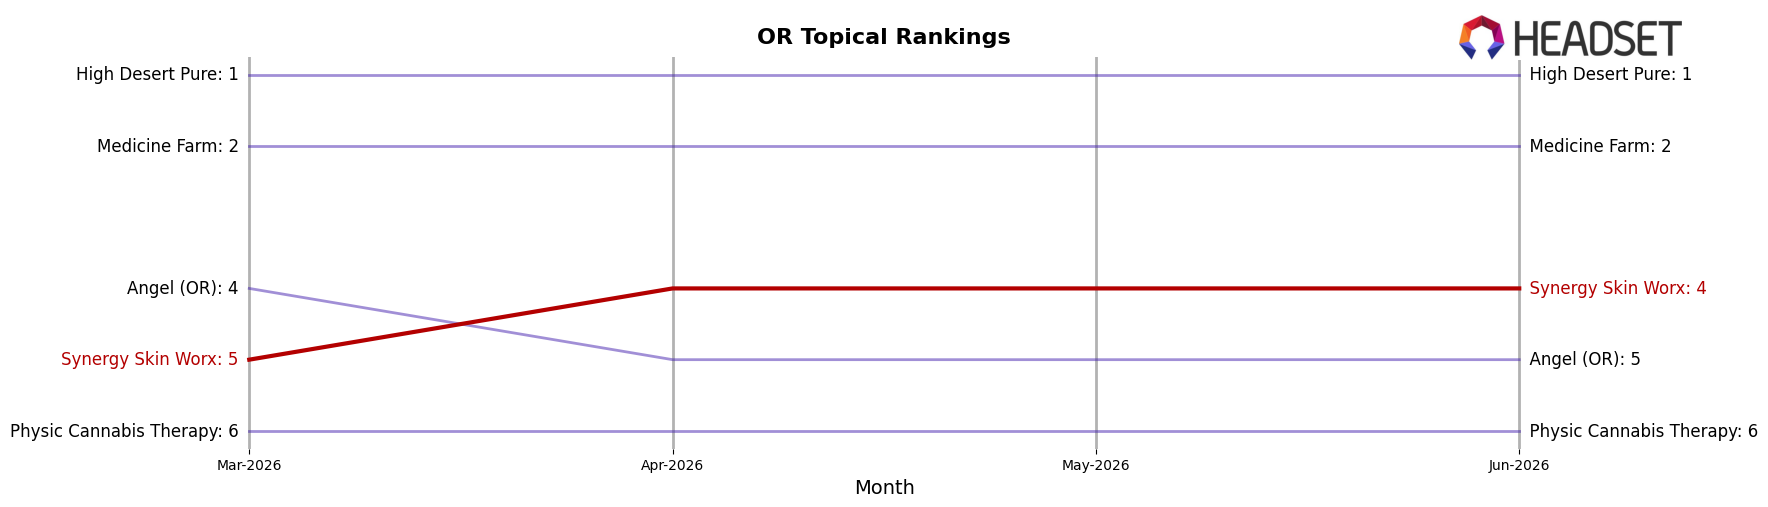
Synergy Skin Worx is currently ranked #4 in OR Topical for June 2026, improving 1 position from #5 year over year and rising 1 spot from #5 in March 2026, while still trailing its peak at #3 in October 2025; in contrast, High Desert Pure held at #1 year over year despite a 15.0% YoY sales decline, and Buddies stayed at #3 while its sales fell 23.3% YoY. The competitive middle tightened as Medicine Farm remained #2 with 5.9% YoY sales growth and Angel (OR) slipped from #4 to #5 alongside a 36.0% YoY sales contraction, signaling that Synergy Skin Worx’s climb into #4 is less about broad market expansion and more about outpacing declining rivals, implying a pathway to reclaim #3 if it converts relative stability into share gains against weakening incumbents.
Notable Products
THC Transdermal Patch (0.5mg CBD, 40mg THC) led the month’s movement with a -71.18% MoM drop and slid to rank 6, while CBD/THC 1:1 Transdermal Patch (25mg CBD, 24mg THC) surged +85.36% MoM to rank 4. The category’s leader CBD/CBN/CBC/CBG/THC Entourage Patch (1.89mg CBD, 4mg CBN, 4mg CBC, 2mg CBG, 46.02mg THC) fell -17.47% MoM at rank 1, even as the High CBD Transdermal Patch (60.98mg CBD, 4.8mg THC) gained +26.61% MoM to rank 3. With five of the top six SKUs being transdermal patches and only one posting a decline worse than -20%, the mix indicates a pivot toward balanced and CBD-forward patches crowding out the single-compound THC option.
Top Selling Cannabis Brands
Data for this report comes from real-time sales reporting by participating cannabis retailers via their point-of-sale systems, which are linked up with Headset’s business intelligence software. Headset’s data is very reliable, as it comes digitally direct from our partner retailers. However, the potential does exist for misreporting in the instance of duplicates, incorrectly classified products, inaccurate entry of products into point-of-sale systems, or even simple human error at the point of purchase. Thus, there is a slight margin of error to consider. Brands listed on this page are ranked in the top twenty within the market and product category by total retail sales volume.

