.svg)

Sep-2026
Sales
Trend
6-Month
Product Count
SKUs
Avg Price
YoY Sales Change
YoY Price Change


Where to Buy
Pine + Star is stocked at 186 licensed dispensaries across Massachusetts and Maine, 121 of them in Massachusetts, with the deepest coverage in Boston, Springfield, Worcester, Dracut, and Greenfield. Search by ZIP code or city below to find the closest one, or filter by product type if you are after a specific format.
Market Insights Snapshot
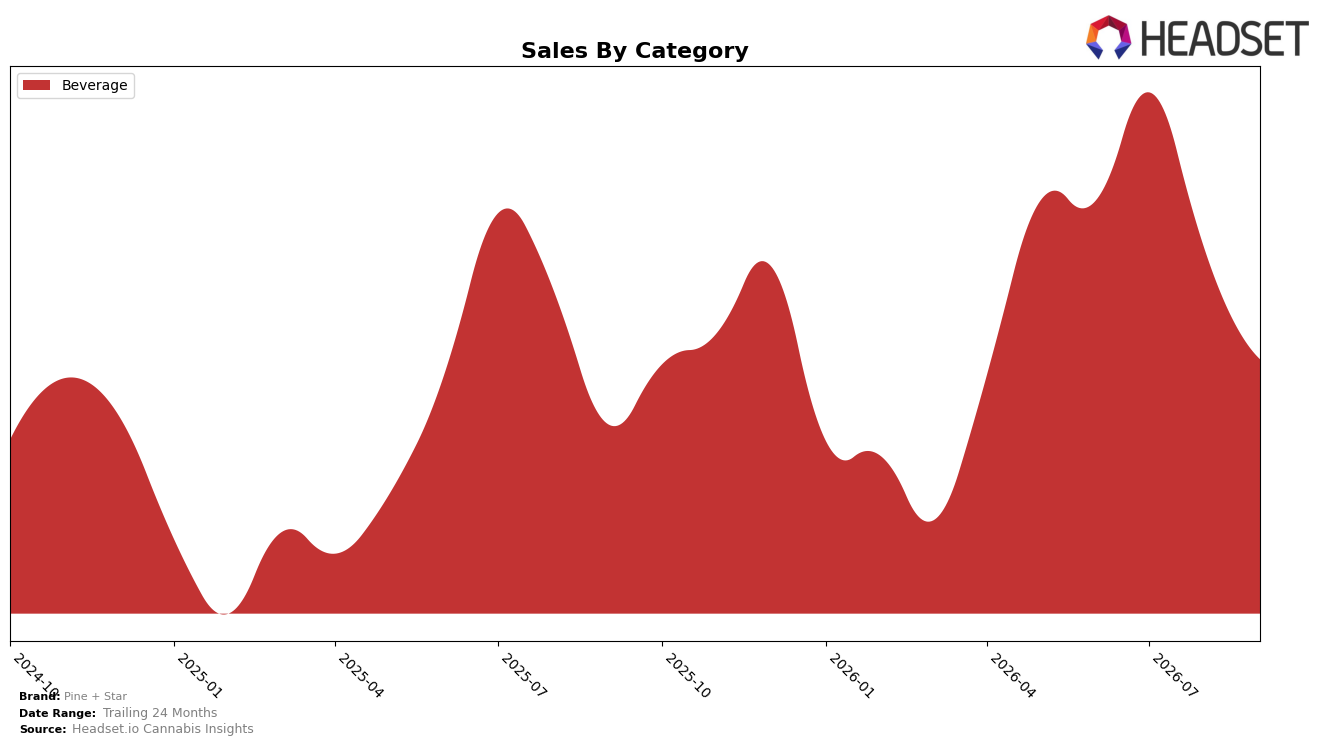
In September 2026, Pine + Star operated as a single-category brand with Beverage at 100.0% of sales share, recording a 9.8% year-over-year increase alongside a 13.1% month-over-month decline. Average price rose 3.3% YoY to $6.06 while category sales growth outpaced price, indicating unit expansion YoY even as the MoM pullback suggests seasonal or promotional normalization from August. Within Massachusetts Beverage, the brand held rank 4, and the juxtaposition of rank stability with a double-digit MoM dip implies volume sensitivity to in-period levers despite a positive YoY trajectory.
The combination of 100.0% dependence on Beverage and a 9.8% YoY lift, against a 13.1% MoM contraction, positions Pine + Star as a category specialist whose demand concentrates around specific monthly drivers rather than a diversified revenue base. With rank 4 in Massachusetts Beverage and a 3.3% YoY price increase, the pattern implies pricing headroom without immediate share erosion, but the MoM volatility signals that maintaining rank will require stabilizing in-month velocity rather than further price-led gains.
Competitive Landscape
Pine + Star sits at #4 in MA Beverage in September 2026, improving 1 rank position YoY from #5 to #4 while holding flat versus June 2026 at #4; that stability contrasts with Levia holding #1 YoY with 18.6% sales growth and Chill Medicated slipping from #4 to #5 alongside a -22.2% YoY sales change. Against the middle tier, Hi5 Seltzer remains #2 with 34.3% YoY growth and Buzzy stays #3 with 1.3% YoY growth, framing Pine + Star’s move as displacement-driven rather than broad market lift; with a peak rank of #4 achieved in September 2026 and no advance over the last 3 months, the trajectory implies Pine + Star is capped by entrenched leaders and must outpace low-growth #3 by more than 1 rank to break into the top three.

Notable Products
Cinnamon Cider Infused Sparkling Beverage (5mg THC, 12oz, 355ml) delivered the month’s sharpest movement with a +291.7% MoM surge into rank 9, while Sparkling Cinnamon Cider Seltzer (5mg THC, 355ml, 12oz) jumped +94.2% at rank 7, indicating seasonal cinnamon variants are pulling share despite Blueberry Lemonade Sparkling Beverage (5mg THC, 355ml, 12oz) slipping -13.4% at rank 1. Strawberry Lemonade Sparkling Beverage (5mg THC, 355ml, 12oz) fell -16.1% at rank 3 and Tea & Lemonade (5mg THC, 12oz) declined -27.6% at rank 4, and with five of the top six posting double-digit MoM declines against two cinnamon SKUs’ outsized gains, the mix points to a pivot from summer citrus to autumn spice that Pine + Star can lean into with targeted production and merchandising.
Top Selling Cannabis Brands






Data for this report comes from real-time sales reporting by participating cannabis retailers via their point-of-sale systems, which are linked up with Headset’s business intelligence software. Headset’s data is very reliable, as it comes digitally direct from our partner retailers. However, the potential does exist for misreporting in the instance of duplicates, incorrectly classified products, inaccurate entry of products into point-of-sale systems, or even simple human error at the point of purchase. Thus, there is a slight margin of error to consider. Brands listed on this page are ranked in the top twenty within the market and product category by total retail sales volume.

