Jun-2026
Sales
Trend
6-Month
Product Count
SKUs
Avg Price
YoY Sales Change
YoY Price Change
Market Insights Snapshot
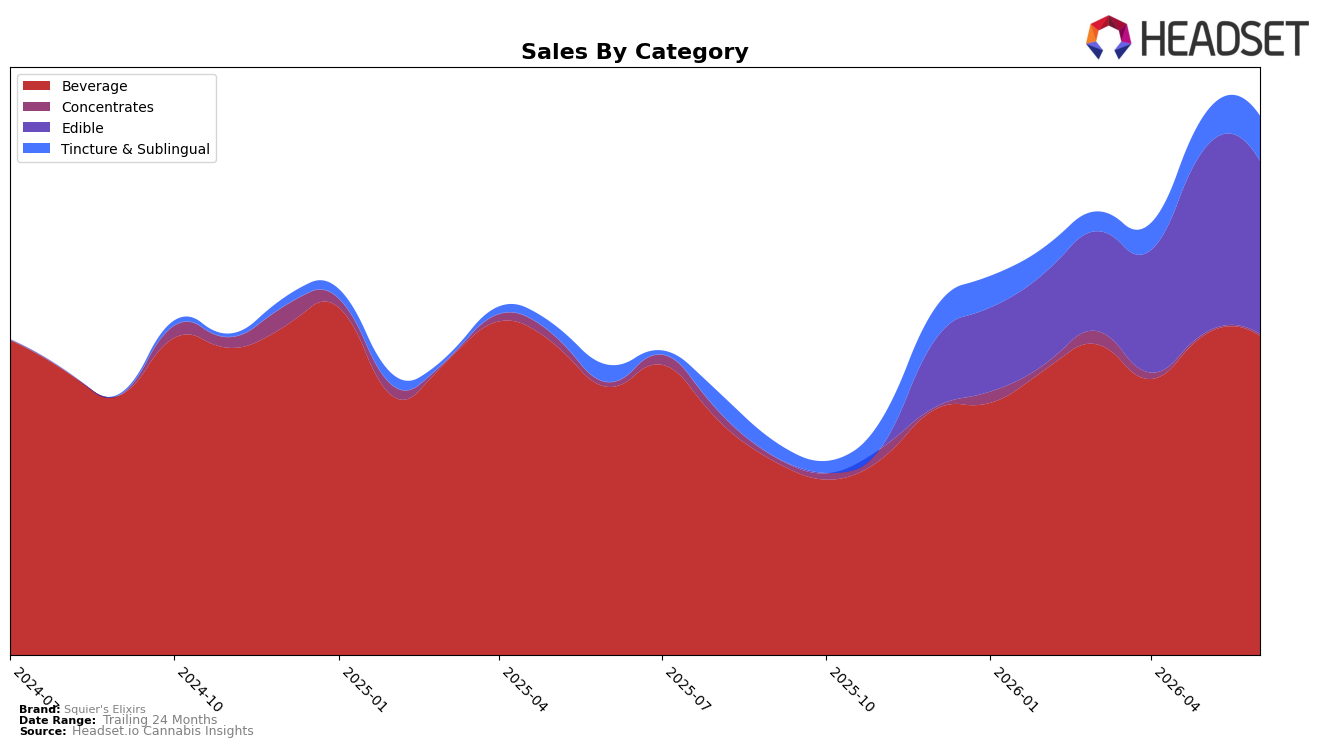
Beverage holds 59.24% share in June 2026 with 19.03% YoY growth but a -0.33% MoM dip, while Tincture & Sublingual is 8.36% share with 166.66% YoY and 32.91% MoM growth, signaling a fast-ascending secondary pillar. Edible sits at 32.07% share with a -6.32% MoM decline and no YoY figure provided, and Concentrates is 0.32% share with -59.58% YoY and 15.12% MoM, indicating a minimal, volatile tail; together these shifts imply Squier's Elixirs is consolidating around Beverage scale while reallocating momentum toward Tincture & Sublingual to offset Edible softness.
With Beverage ranked 5 in Massachusetts and average price down -2.97% YoY to $26.37 as June 2026 brand sales rose 86.21% YoY, the mix suggests a value-leaning stance that preserves Beverage rank while funding expansion in faster-growing Tincture & Sublingual. The combination of a -0.33% MoM pause in Beverage against a 32.91% MoM surge in Tincture & Sublingual implies portfolio risk is shifting from category concentration toward growth optionality, positioning Squier's Elixirs to trade share within its own lineup rather than depend on incremental gains from Edible's -6.32% MoM.
Competitive Landscape
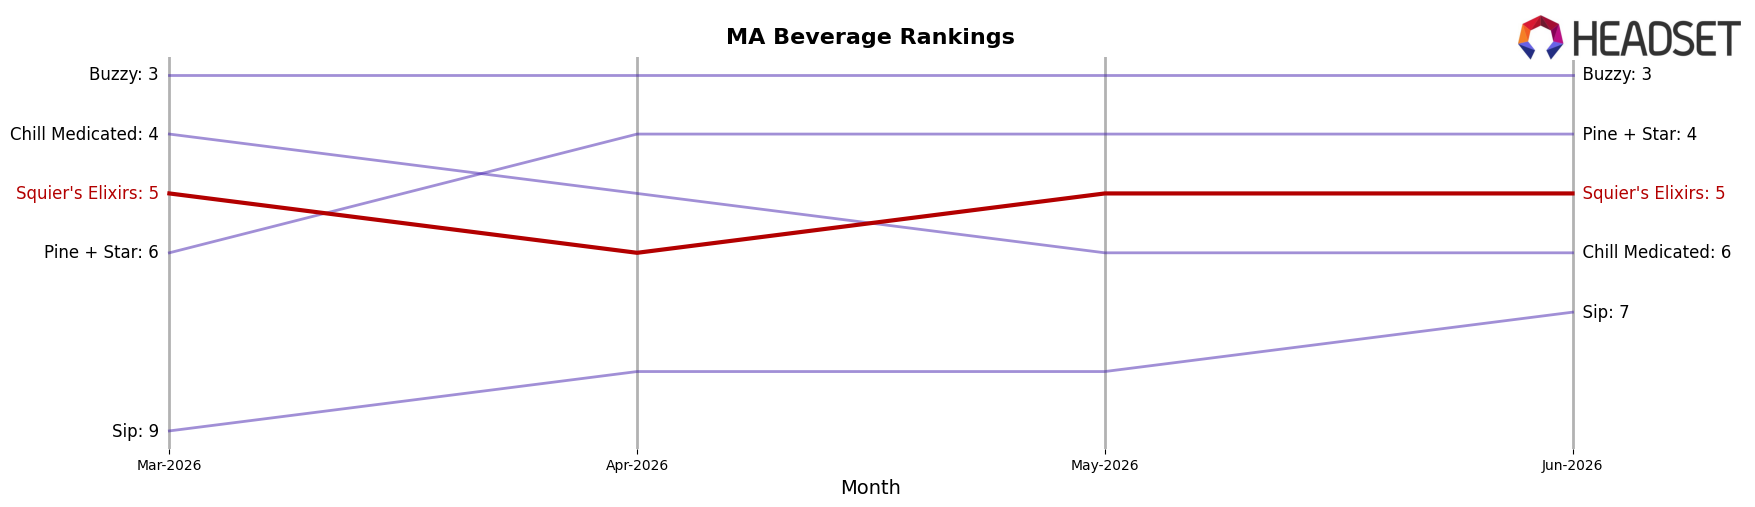
Squier's Elixirs sits at rank #5 in MA Beverage in June 2026, improving 1 place YoY from #6, while holding flat versus March 2026 at #5; the brand’s peak rank is #5 reached in June 2026, which signals a ceiling that has not yet been broken. Competitively, Levia held #1 YoY to #1 current with a 35.5% sales YoY change, and Hi5 Seltzer stayed at #2 with a 31.9% YoY increase, whereas Buzzy remained #3 with a -15.9% YoY decline and Pine + Star climbed from #5 to #4 with a 13.3% YoY gain; that mix—leaders expanding while a mid-pack rival loses ground—places Squier's Elixirs in a narrow window where displacement of #4 is plausible but cracking the top three requires outpacing two competitors growing more than 30% YoY. The pattern implies a stabilizing rank trajectory at #5 with upside contingent on converting Buzzy’s -15.9% contraction into share capture faster than Pine + Star’s 13.3% climb and narrowing the gap to leaders compounding above 30% YoY.
Notable Products
THC/THCV 1:1 White Peach & Apricot Hash Rosin Gummies 20-Pack (100mg THC, 100mg THCV) posted the steepest decline in June 2026 at -31.4% and slipped to rank 6, while CBD/CBN/THC 2:1:1 Blackberry Lavender Hash Rosin Gummies 20-Pack (200mg CBD, 100mg CBN, 100mg THC) surged +85.5% to rank 1. Among beverages, Blueberry Lemon Hash Rosin Elixir Mix (500mg THC, 4oz) rose +17.2% at rank 2 as Pink Pineapple Hash Rosin Drink Elixir (500mg THC, 4oz) fell -9.9% at a tied rank 4, indicating share reallocation within the liquid lineup. Four of the top ten are Edible SKUs spanning ranks 1, 5, 6, and 8–9, but the split trajectory—one at +85.5% and two at -31.4% and -12.2%—implies polarization between multi-cannabinoid wellness formats and more traditional flavor SKUs. The mix suggests Squier's Elixirs is tilting toward higher-dose, functional profiles in Edibles while beverages consolidate around a single front-runner, concentrating investment where velocity is demonstrably accelerating.
Top Selling Cannabis Brands
Data for this report comes from real-time sales reporting by participating cannabis retailers via their point-of-sale systems, which are linked up with Headset’s business intelligence software. Headset’s data is very reliable, as it comes digitally direct from our partner retailers. However, the potential does exist for misreporting in the instance of duplicates, incorrectly classified products, inaccurate entry of products into point-of-sale systems, or even simple human error at the point of purchase. Thus, there is a slight margin of error to consider. Brands listed on this page are ranked in the top twenty within the market and product category by total retail sales volume.

