.svg)

Sep-2026
Sales
Trend
6-Month
Product Count
SKUs
Avg Price
YoY Sales Change
YoY Price Change


Market Insights Snapshot
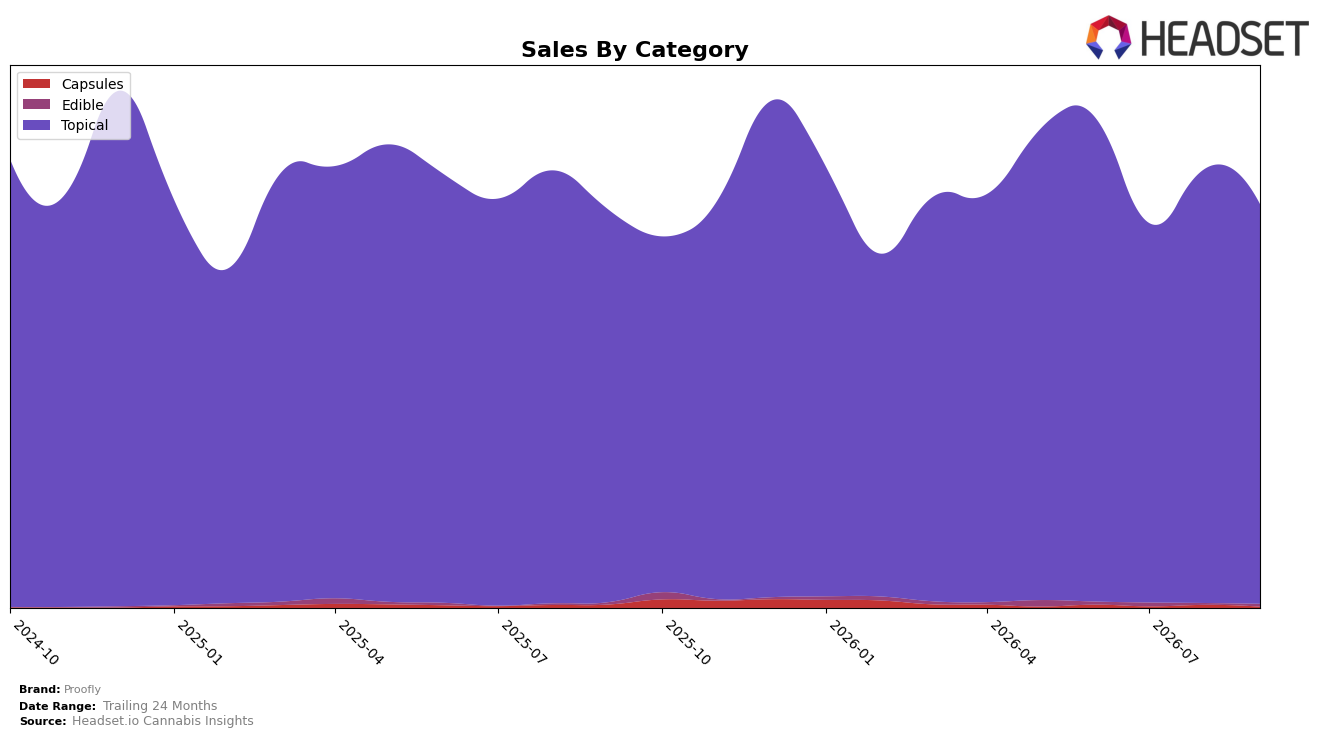
Proofly’s category mix in September 2026 is overwhelmingly concentrated in Topical, holding 99.21% share with a year-over-year change of 1.79% and a month-over-month decline of 7.91%. Edible expanded its tiny base to 0.60% share with 29.62% year-over-year growth and a 75.68% month-over-month jump, while Capsules contracted to 0.19% share with a 74.16% year-over-year drop and a 70.58% month-over-month decline. Against a brand-level year-over-year sales change of 1.36% and an average price up 0.47%, the simultaneous Topical MoM pullback and Edible MoM surge imply a mix shift forming at the margin that could dilute single-category dependency if sustained.
With Topical anchoring the portfolio and ranked 1 in British Columbia, the 7.91% month-over-month softening in Topical alongside a 75.68% Edible month-over-month lift signals early experimentation that could reallocate a few tenths of share away from a 99% Topical footprint. Given brand sales are up 1.36% year over year but down 15.18% over 24 months, the combination of slight Topical resilience (+1.79% YoY) and deep Capsule contraction (−74.16% YoY) suggests Proofly’s near-term positioning remains Topical-led while selectively expanding Edible to offset volatility and stabilize multi-period comparisons.
Competitive Landscape
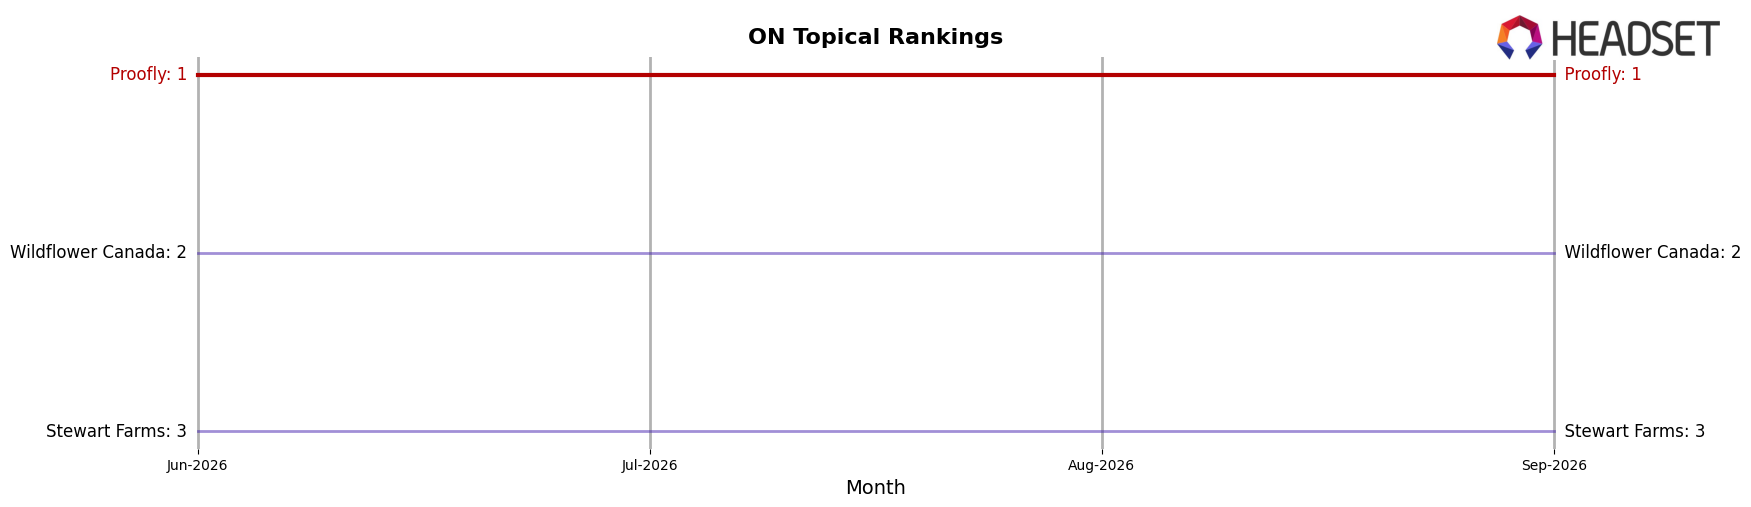
Proofly sits at #1 in ON Topical in September 2026 and is flat year over year at #1, while Wildflower Canada holds #2 after improving from #3 with a 21.1% YoY sales lift and Stewart Farms slipped to #3 from #2 alongside a 40.3% YoY sales decline; meanwhile, Wildflower advanced from #6 to #4 with a 61.9% YoY gain as ufeelu stayed at #5 with 6.5% YoY growth, indicating that Proofly’s unchanged #1 rank amid upward pressure from faster-rising rivals implies the category’s growth leaders are compressing the distance at the top.
Notable Products
CBG/CBD/THC 1:1:1 Relief Cream (250mg CBG, 250mg CBD, 250mg THC, 100g) posted the steepest decline at -16.5% month over month while sliding to rank 2, versus the category’s top seller CBD/THC Extra Strength Relief Cooling Gel (2000mg CBD, 100mg THC, 100g) dipping a smaller -4.0% at rank 1. CBD:THC 1:20 Muscle THC Body Cream (25mg CBD,500mg THC,100ml) bucked the trend with a +44.9% MoM lift to rank 8, yet overall eight of the top ten are Topical creams and gels with negative MoM shifts between -1.8% and -26.4%. The concentration of THC-forward creams alongside declines for mixed CBG/CBD/THC formats implies Proofly is tilting demand toward simpler, high-THC or high-CBD propositions while multi-cannabinoid premium tiers face elasticity.
Top Selling Cannabis Brands






Data for this report comes from real-time sales reporting by participating cannabis retailers via their point-of-sale systems, which are linked up with Headset’s business intelligence software. Headset’s data is very reliable, as it comes digitally direct from our partner retailers. However, the potential does exist for misreporting in the instance of duplicates, incorrectly classified products, inaccurate entry of products into point-of-sale systems, or even simple human error at the point of purchase. Thus, there is a slight margin of error to consider. Brands listed on this page are ranked in the top twenty within the market and product category by total retail sales volume.

