Jun-2026
Sales
Trend
6-Month
Product Count
SKUs
Avg Price
YoY Sales Change
YoY Price Change
Market Insights Snapshot
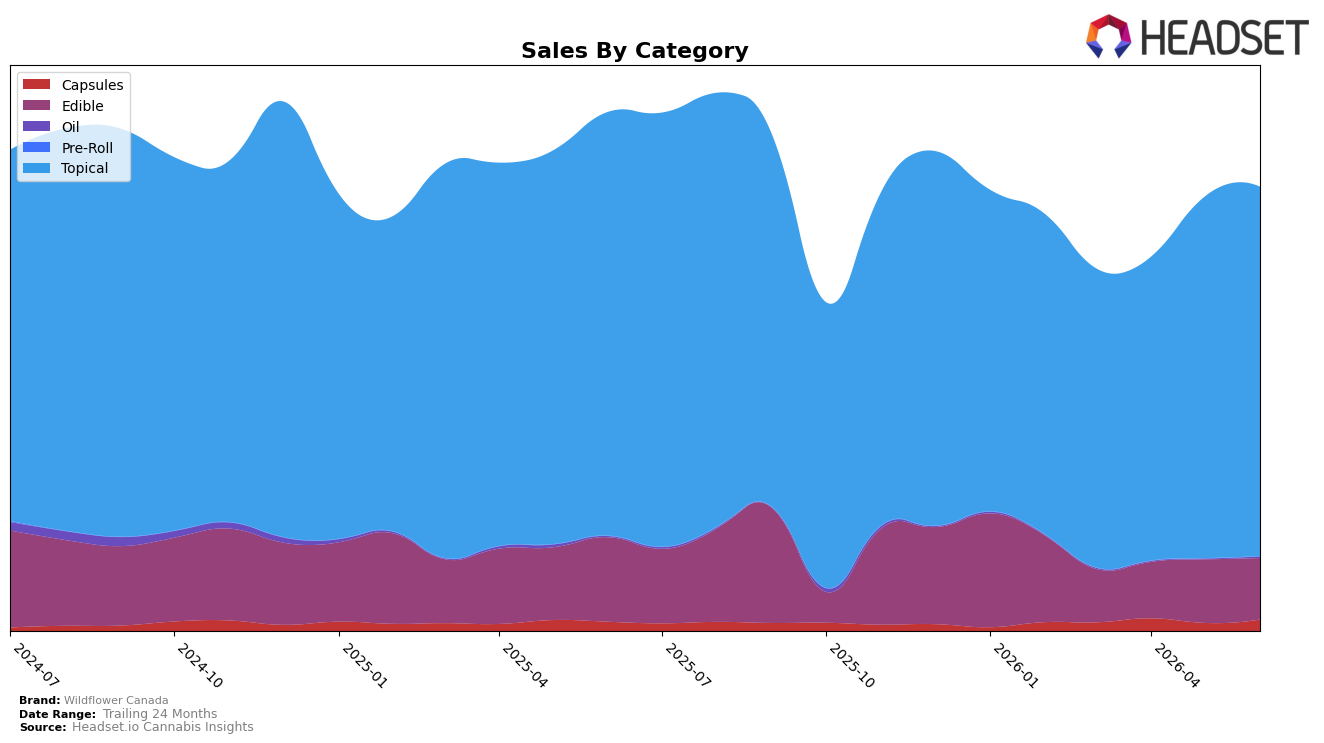
Wildflower Canada concentrated 83.40% share in Topical during June 2026, with Topical sales up 2.18% month over month but down 12.87% year over year, while Edible held 13.81% share with a 3.27% month-over-month decline and a 27.35% year-over-year drop. The smallest lines pivoted sharply: Capsules, at 2.53% share, rose 43.51% MoM and 24.88% YoY, and Oil, though just 0.26% share, jumped 214.80% MoM and 57.36% YoY; against this mix, the brand’s average price increased 5.50% YoY as overall brand sales fell 14.47% YoY. The pattern implies deliberate reinforcement of the Topical core while using Capsules and Oil as higher-velocity niches to offset Edible contraction and stabilize month-over-month momentum.
With rank 1 in Topical in Alberta and 83.40% of sales rooted in that category, June 2026 positioning leans into authority where the brand is already entrenched, even as Edible weakness at −27.35% YoY suggests deprioritization of formats less aligned to the price point of $34.11 and the Topical average price of $53.24. The double-digit MoM surges in Capsules (+43.51%) and Oil (+214.80%) paired with Topical’s modest +2.18% MoM indicate a barbell approach: protect the category where rank leadership is established while testing growth vectors in adjacent wellness formats; this sets up a path to recapture the −14.47% YoY brand sales gap through small-share, high-growth extensions rather than broad discounting.
Competitive Landscape
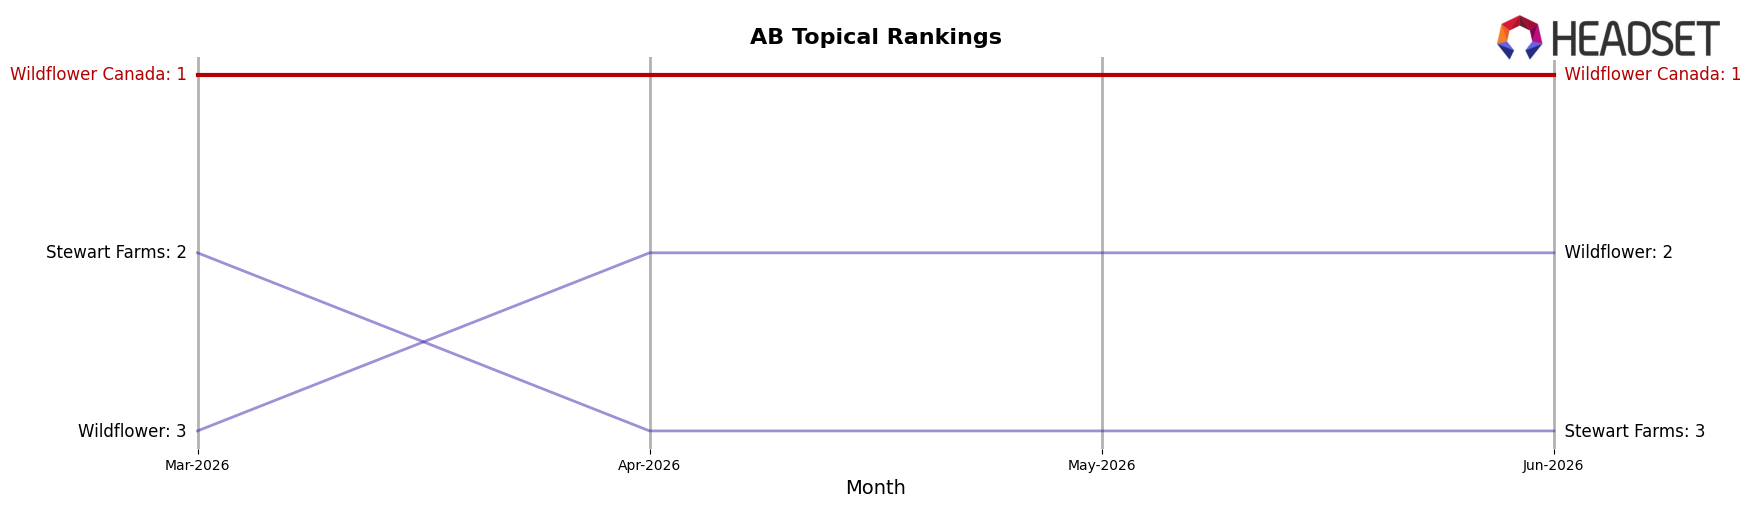
Wildflower Canada sits at #1 in AB Topical in June 2026 with no year-over-year rank change from #1, and no three-month change from #1, indicating a stable hold while Wildflower climbed from #5 to #2 on 465.2% year-over-year sales growth; by contrast, Stewart Farms fell from #2 to #3 with a 57.0% sales decline and Proofly slid from #3 to #4 with a 20.1% drop, as Solei moved from #4 to #5 alongside a 31.4% decline. These simultaneous rank shifts—flat at #1 for Wildflower Canada, upward pressure from a former #5 now at #2, and broad declines among ranks #3–#5—imply that the brand’s top position is defended by steadiness rather than acceleration, so the trajectory signals retention risk if the fast-rising #2 sustains outsized growth.
Notable Products
CBD:THC 1:1 Relief Stick (105mg CBD, 105mg THC, 30g) posted the largest move in June 2026 with a 172.8% month-over-month increase, climbing to rank 5, while CBD/THC/CBN 4:2:1 Sweet Dreams Oil (30ml) surged 214.8% MoM but remained at rank 7, indicating growth concentrated in smaller-volume SKUs. In contrast, CBD Extra Strength Relief Stick (1000mg CBD, 60g) fell 90.1% MoM yet still held rank 1 with $277,372 in sales, and Sweet Dreams - CBD/CBN/THC 10:10:2 Goji Berry Gummies 5-Pack (50mg CBD,50mg CBN,10mg THC) slid 3.3% MoM at rank 2, signaling dependence on a single flagship despite contraction. With three Topical SKUs in the top six and positions spanning rank 1 to rank 6, the portfolio is tilting toward diversified relief formats where smaller Topical variants capture momentum even as the leading stick retrenches; this mix implies a pivot from a flagship-led strategy toward a broader, multi-SKU Topical franchise.
Top Selling Cannabis Brands
Data for this report comes from real-time sales reporting by participating cannabis retailers via their point-of-sale systems, which are linked up with Headset’s business intelligence software. Headset’s data is very reliable, as it comes digitally direct from our partner retailers. However, the potential does exist for misreporting in the instance of duplicates, incorrectly classified products, inaccurate entry of products into point-of-sale systems, or even simple human error at the point of purchase. Thus, there is a slight margin of error to consider. Brands listed on this page are ranked in the top twenty within the market and product category by total retail sales volume.

