Market Insights Snapshot
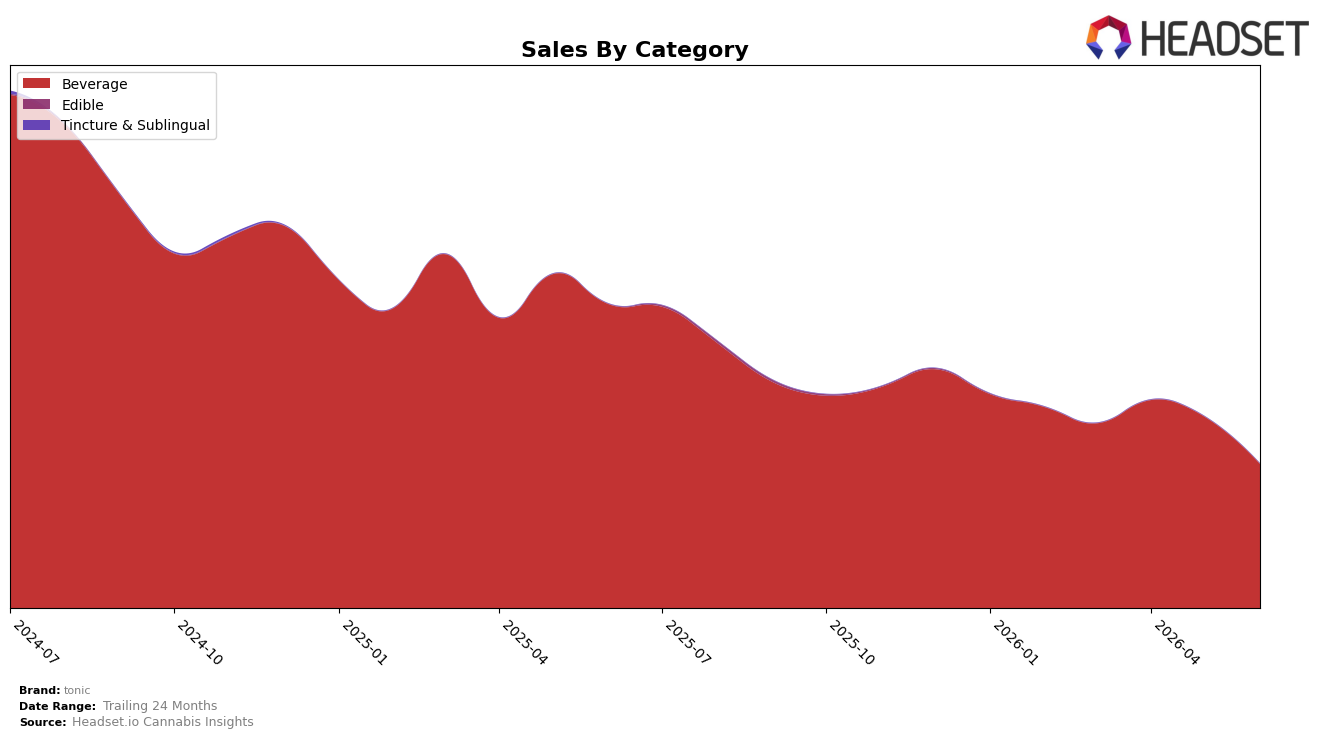
In June 2026, tonic’s category mix was concentrated in Beverage at 99.98% share with a year-over-year decline of 52.63% and a month-over-month drop of 24.68%, while the residual 0.02% in Tincture & Sublingual lacked measurable YoY or MoM signals. Average price fell 10.36% YoY to $6.87 as Beverage pricing held near $6.87, aligning the brand’s overall 52.63% YoY sales contraction with the Beverage segment’s 52.63% YoY trend. With Beverage ranked 5 in Illinois, the compression in both category share and MoM trajectory indicates that short-term volume softness is concentrated in the core segment rather than driven by mix shifts, implying the near-term lever is velocity recovery within Beverage rather than diversification.
The 24.68% MoM decline within Beverage, alongside a 10.36% YoY price decrease, signals that tonic is leaning on price while losing volume intensity, and the 99.98% concentration suggests exposure to single-category cyclicality instead of cross-category buffering. Holding rank 5 in Illinois for Beverage while posting a 52.63% YoY decline implies share defense depends on stabilizing Beverage sell-through more than expanding the 0.02% Tincture & Sublingual footprint; the pattern indicates positioning as a price-accessible Beverage specialist whose near-term risk is volume elasticity rather than portfolio dilution.
Competitive Landscape
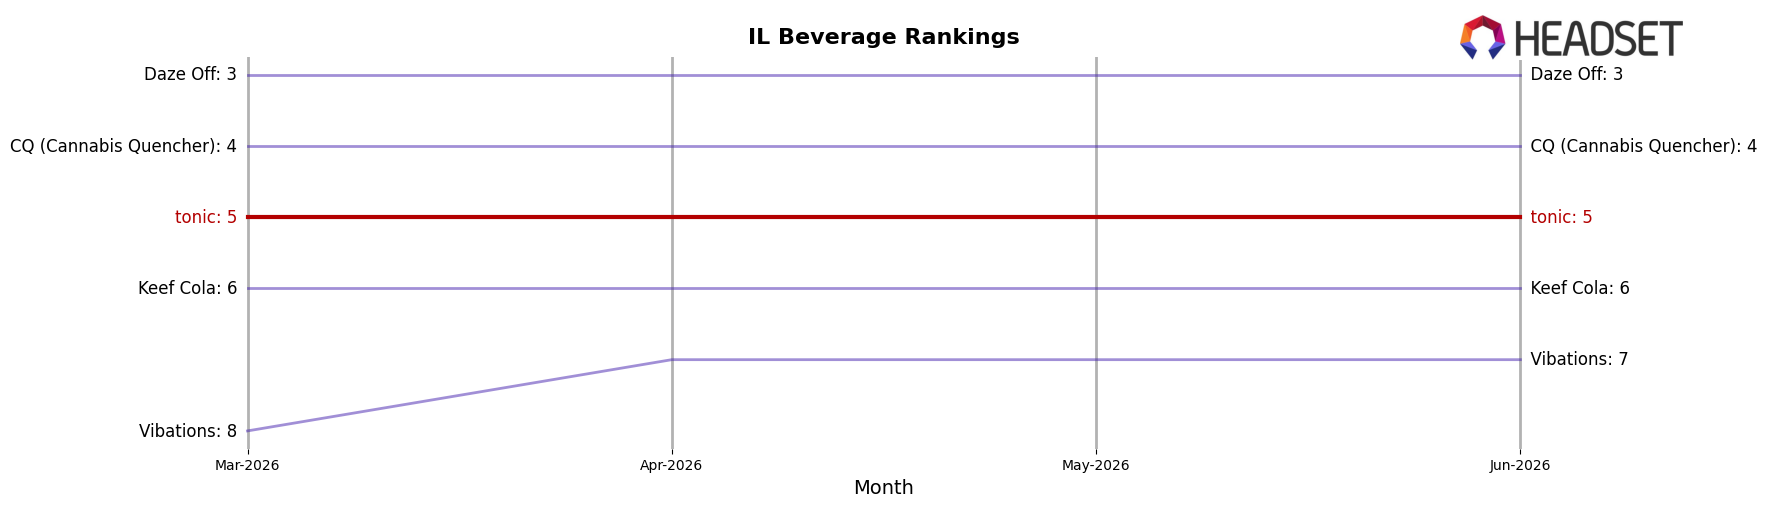
tonic ranks #5 in IL Beverage in June 2026, unchanged from #5 year over year, with its three-month position also at #5, while its peak was #3 in November 2024; in contrast, Daze Off advanced from #4 to #3 on 50.97% YoY sales growth and CQ (Cannabis Quencher) slid from #3 to #4 on a 0.59% YoY decline, and Uncle Arnie's held #1 despite a 30.53% YoY drop while Journeyman stayed #2 with 29.52% YoY growth; the pattern implies tonic’s flat rank amid upward and downward moves nearby signals share stability but limited momentum to reclaim the #3 peak without a displacement event in the #3–#4 lane.
Notable Products
Fizz Shortie - CBD/THC 1:1 Grapefruit Tonic Mini Seltzer (10mg CBD, 10mg THC, 7oz) posted a 70.8% month-over-month gain in June 2026 to rank 2, contrasting with Mandarin Orange Tonic (100mg THC, 12oz) dropping 21.3% while holding rank 1. Three SKUs fell more steeply than -25% — Raspberry Lemonade Tonic at -38.2% from rank 7, Mango Pineapple Seltzer at -36.3% from rank 4, and CBD/THC 1:1 Tropical Punch Tonic at -27.0% from rank 3 — pointing to broad pullback in full-size 12oz formats. The top ten is fully concentrated in Beverage, with minis rising into rank 2 as 12oz tonics slide across multiple ranks, implying mix is tilting toward smaller-dose or balanced-CBD formats over legacy 100mg THC 12oz anchors.
Top Selling Cannabis Brands
Data for this report comes from real-time sales reporting by participating cannabis retailers via their point-of-sale systems, which are linked up with Headset’s business intelligence software. Headset’s data is very reliable, as it comes digitally direct from our partner retailers. However, the potential does exist for misreporting in the instance of duplicates, incorrectly classified products, inaccurate entry of products into point-of-sale systems, or even simple human error at the point of purchase. Thus, there is a slight margin of error to consider. Brands listed on this page are ranked in the top twenty within the market and product category by total retail sales volume.

