Dec-2025
Sales
Trend
6-Month
Product Count
SKUs
Avg Price
YoY Sales Change
YoY Price Change
Market Insights Snapshot
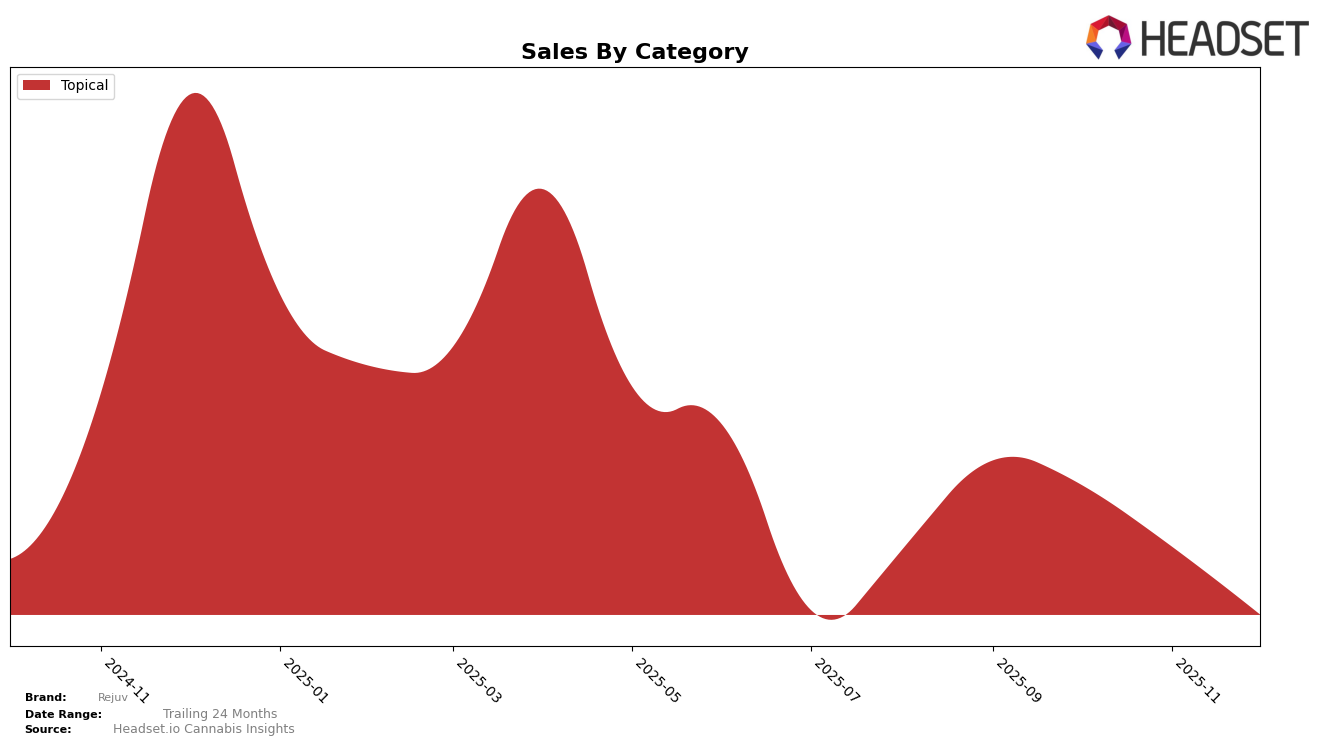
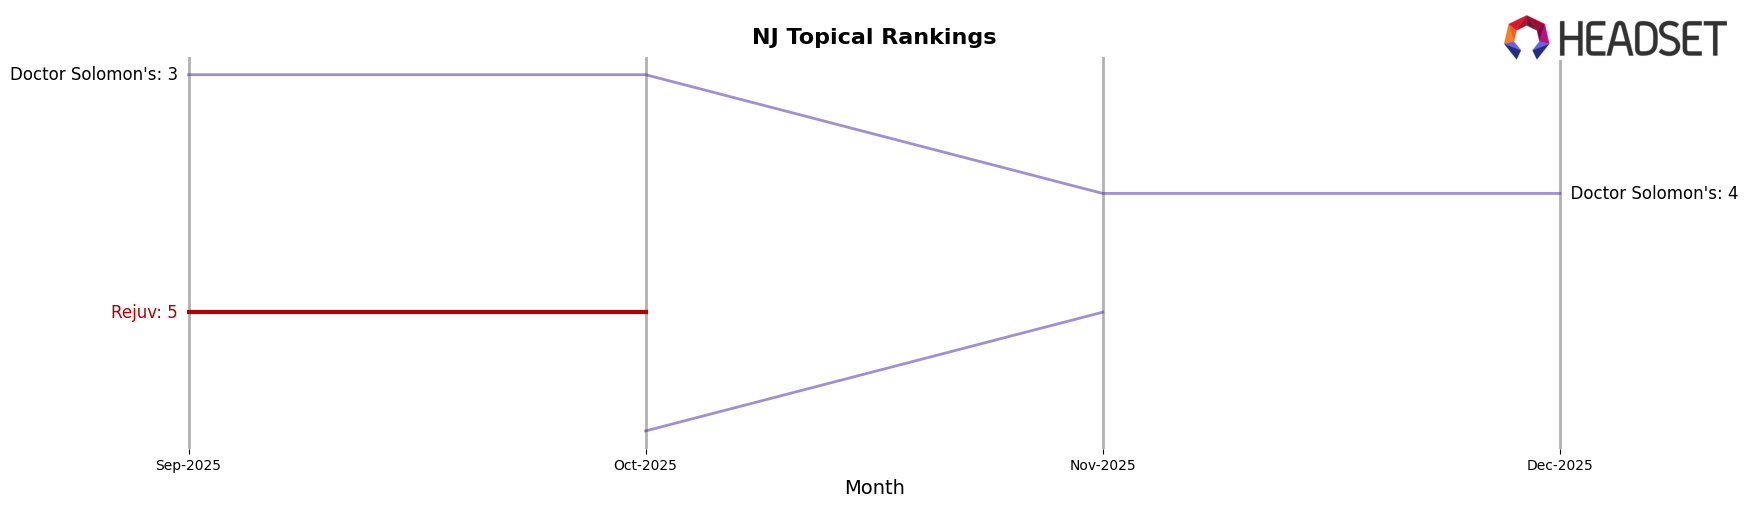
Rejuv has shown a consistent performance in the Topical category in New Jersey during the fall of 2025, maintaining a steady rank of 5th place in both September and October. This stability suggests a solid market presence, although the absence of rankings for November and December might indicate a drop out of the top 30, which could be a point of concern for stakeholders. The brand's sales in October saw a slight decline from September, which may be reflective of broader market trends or increased competition within the state.
While Rejuv's performance in New Jersey's Topical category is noteworthy, the lack of data for November and December could imply a strategic shift or market challenges that the brand may be facing. It's important to consider how this might impact their positioning in the upcoming months and how they plan to regain or maintain their standing in the competitive landscape. Observing the brand's movements in other states or categories could provide further insights into their overall strategy and market adaptability.
Competitive Landscape
In the New Jersey Topical category, Rejuv has maintained a steady position, holding the 5th rank in both September and October 2025. However, the brand did not appear in the top 20 for November and December, indicating a potential decline in market presence or sales performance during these months. In contrast, Doctor Solomon's consistently held a strong position, ranking 3rd in September and October, and slightly dropping to 4th in November and December. This suggests that Doctor Solomon's has a more stable customer base or effective marketing strategies that help maintain its market position despite fluctuations. Meanwhile, Drool showed an upward trend, moving from 6th in October to 5th in November, which could pose a competitive threat to Rejuv if this trend continues. These dynamics highlight the competitive pressures Rejuv faces in maintaining its market share and the importance of strategic adjustments to regain its ranking in the upcoming months.
Notable Products
In December 2025, the top-performing product from Rejuv was the CBD/THC 1:1 Recover Transdermal Patch, maintaining its first-place ranking from November despite a decrease in sales to 113 units. The CBD/THC 10:1 Relieve Transdermal Patch followed in second place, consistent with its rank from the previous month, although it experienced a decline in sales. The Renew Transdermal Patch held steady in third place, showing a continued downward trend in sales figures since September. The CBD/CBG/CBN/CBC/THC 7:2:1:1:1 Relax Entourage Transdermal Patch remained in fourth place, with a significant drop in sales compared to earlier months. The CBD/THC 12:1 Relieve Transdermal Patch maintained its position in fifth place with minimal change in sales figures from November to December.
Top Selling Cannabis Brands
Data for this report comes from real-time sales reporting by participating cannabis retailers via their point-of-sale systems, which are linked up with Headset’s business intelligence software. Headset’s data is very reliable, as it comes digitally direct from our partner retailers. However, the potential does exist for misreporting in the instance of duplicates, incorrectly classified products, inaccurate entry of products into point-of-sale systems, or even simple human error at the point of purchase. Thus, there is a slight margin of error to consider. Brands listed on this page are ranked in the top twenty within the market and product category by total retail sales volume.

