.svg)

Sep-2026
Sales
Trend
6-Month
Product Count
SKUs
Avg Price
YoY Sales Change
YoY Price Change


Where to Buy
Drool is stocked at 419 licensed dispensaries across Mississippi, New Mexico, and 4 other states, 102 of them in Mississippi, with the deepest coverage in Jackson, Biloxi, Hattiesburg, Ocean Springs, and Meridian. Search by ZIP code or city below to find the closest one, or filter by product type if you are after a specific format.
Market Insights Snapshot
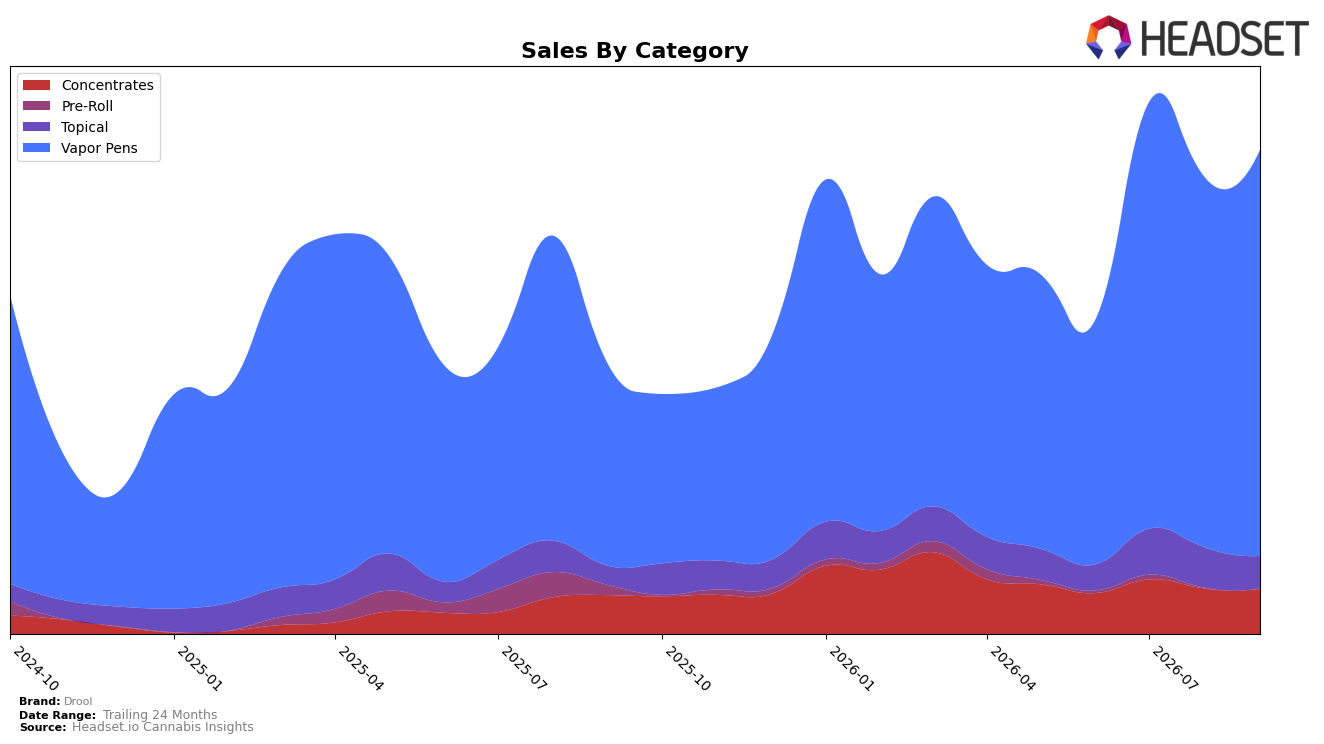
In September 2026, Vapor Pens held 84.06% share with year-over-year growth of 102.09% and month-over-month growth of 9.75%, while Concentrates sat at 9.29% share with 16.38% YoY and a -0.70% MoM contraction. Topical accounted for 6.65% share with 70.86% YoY but a -19.89% MoM decline, and the brand’s average price fell 10.26% YoY to $46.56 alongside a 80.25% YoY lift in total sales. With Vapor Pens anchoring category exposure and a rank of 36 in Vapor Pens within New Jersey, the mix indicates concentration is paying off at the expense of breadth, implying that September 2026 performance leaned on scale gains in a single category while near-term volatility in Topical constrained diversification.
The shift toward Vapor Pens at 84.06% share alongside a 9.75% MoM uptick, versus Topical’s -19.89% MoM and Concentrates’ -0.70% MoM, implies Drool is prioritizing velocity over portfolio balance, using price elasticity from a 10.26% YoY price decline to fuel unit-driven gains. With 102.09% YoY growth in Vapor Pens and a 70.86% YoY lift in Topical not translating into MoM stability, the brand’s positioning in September 2026 skews toward scaling a category where rank 36 in New Jersey leaves headroom, suggesting near-term share capture depends on sustaining lower realized prices while shoring up weaker repeat in smaller categories.
Competitive Landscape
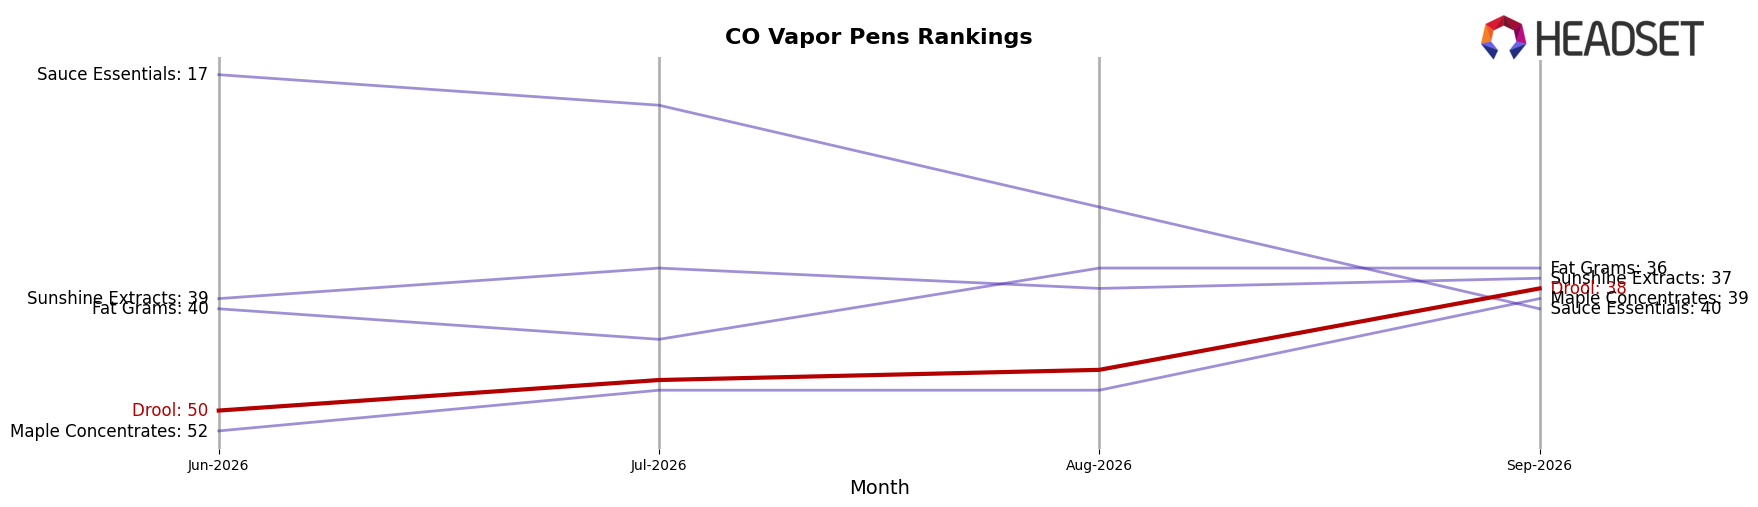
Drool is ranked #38 in Colorado Vapor Pens as of September 2026, improving 12 positions from #50 in June 2026, and hitting its peak rank of #38 in September 2026 with a 24-position climb over three months relative to the top 50 cutoff; meanwhile, Spherex held #1 while edging sales up 1.9% year over year and PAX rose to #2 from #3 with 34.7% sales growth, indicating that Drool’s rapid three-month rank ascent is happening alongside incumbents that are either holding or advancing, which implies a trajectory driven by recent share capture that must sustain against top-tier momentum.
Notable Products
Runtz Live Resin Disposable (1g) posted the standout move with a 74.7% month-over-month gain, climbing to rank 2, while Girl Scout Cookies Live Resin Disposable (2g) slid 16.4% to rank 6. Hybrid RSO Syringe (1g) held rank 1 with a modest 1.4% decline, and King Louis XIII Live Resin Disposable (1g) advanced 48.5% at rank 4. With eight of the top ten in Vapor Pens and a sharp split between 1g MoM gains above 48% and 2g declines as deep as 43.9%, the mix implies Drool is tilting volume toward 1g disposables over larger formats. The concentration in Vapor Pens and the combined $71,859 from the two leading movers suggests near-term focus on faster-turn SKUs to defend share at the top of the ranking.
Top Selling Cannabis Brands






Data for this report comes from real-time sales reporting by participating cannabis retailers via their point-of-sale systems, which are linked up with Headset’s business intelligence software. Headset’s data is very reliable, as it comes digitally direct from our partner retailers. However, the potential does exist for misreporting in the instance of duplicates, incorrectly classified products, inaccurate entry of products into point-of-sale systems, or even simple human error at the point of purchase. Thus, there is a slight margin of error to consider. Brands listed on this page are ranked in the top twenty within the market and product category by total retail sales volume.

